
During my internship with the Center for Accelerating Innovation and Impact (CII) in the Global Health Bureau at USAID, I attended a training that the GeoCenter conducted. They are a team of geospatial analysts who work to integrate a geographic approach into USAID’s development programs. Participants learned how to make and use maps to answer questions about where to best allocate resources. Much of what I learned felt intuitive, after mapping development data with Innovations for Peace and Development (IPD) at UT Austin for the last year. However, the training helped turn what I instinctually knew into a clear process in my mind. It also helped me to better understand the challenges that decision makers face in the absence of data. Making maps can be an involved and difficult process, but it is well worth the benefits.
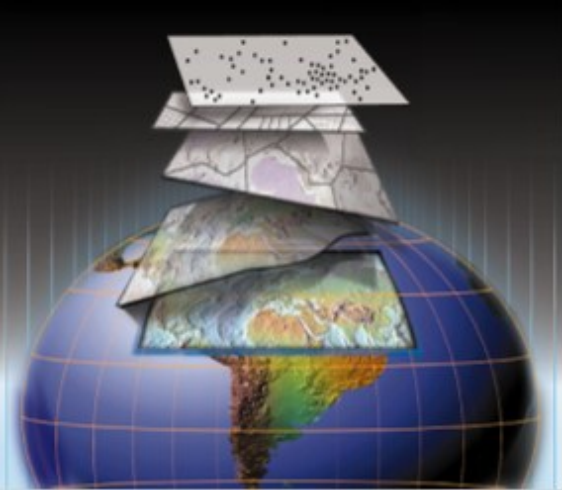
Maps can provide a picture of a development data set, but as helpful as that is, maps can do more. For example, a Geographic Information Systems (GIS) analyst can create a map showing zones with increased flood risks and combine it with a map showing agricultural production. By layering the data on top of each other, a decision maker can determine where to target projects to make crops more flood resistant. Understanding of how several layers of data interact with each other is faster and easier to gain through a map than a spreadsheet.
The geographic approach taught by the GeoCenter involved four steps: question, collect, analyze, and decide. First, the decision maker must determine the question at hand. Once the question is clear, the GIS analyst collects data that will shed light on the issue. In the example I provided, information on zones with an increased risk of flooding may come from one source, while another organization may provide the agricultural production data. Once the GIS analyst has plotted the available data on a map, it’s time to analyze the information by putting everything together. Decision makers can use this analysis to allocate resources where the needs are greatest.
One of the major challenges in this process is collecting data. Maps are a useful way to visualize data, but unfortunately, it isn’t always available. While USAID carefully tracks what it funds, sometimes data isn’t tracked to exact geographic points. To best allocate resources to mitigate the impacts of flood on agricultural production, USAID should avoid sending funds where other development organizations are working on the same problem. This requires gathering data from all other development organizations. Despite the great improvements in data transparency over recent years, development organizations are still a long way from mapping where development money goes and what it does in each place. However, despite the problems of incomplete information, there is significant data available for use.
Mapping can play a part in every stage of USAID’s program cycle and there is a growing interest in their use. Maps help provide the big picture, which can inform agency policy and strategies. USAID missions can use sub-national maps to develop their Country Development Cooperation Strategies (CDCS). If data is detailed enough, maps can contribute to project design and implementation. Monitoring and evaluation can use maps to keep track of what happens, but also compare layers of development data to show project impacts. Throughout USAID and the field of development, there is a growing trend towards harnessing new technologies such as mapping to inform development decisions. It is a trend that I hope continues.
This experience and others I’ve had this summer are thanks to USAID HESN’s (Higher Education Solutions Network) efforts to create this internship program which placed me within the Global Health Bureau’s CII. In the comments, please feel free to share your own experiences with data mapping, or discuss what you would like to see by using maps.