August 2021

Virtual vs. In Person – Perspectives of the Annual ASEE Conference
by Audrey Boklage

and
by Marialice Mastronardi
For the second year, the Center for Engineering Education research team participated in the ASEE conference, held online. A lot has changed since the 2020 virtual edition when switching to an online platform was done due to COVID concerns and protocols. This year the decision to move online was made in advance and much has been learned this year about online events. The conference was very well organized, and the support provided to both presenters and attendees was thorough and easily accessible, allowing participants to quickly navigate and manage the conference events. The presenters were all presenting live. Aside from webinars and presentations, there were several additional spaces for virtual meetings, networking sessions, social events, and even a kids corner. Lastly, to increase engagement, social media activities, like scavenger hunt and trivia twitter, were organized.
It should be mentioned that, as consumers, we have become much more familiar with virtual platforms after an entire year of Zoom meetings and adjustments to move our usual in-person activities online and this may have contributed to our personal enjoyment of this experience.
Of course, there is much missing in an online conference. For example, due to time zone differences (the conference was planned in the Pacific Standard Time zone), sessions may be too early or too late in the day depending on where the attendees are, a problem that wouldn’t exist in an in-person conference. Given the conference occurs during summer, some attendees with children have to negotiate childcare, pickup and drop off, and mealtimes while attending the conference. Additionally (and perhaps obviously), the in-person connections and conversations that often occur spontaneously from passing someone in a hallway or sitting next to them during a session are also lacking. Many research projects and great ideas have originated from these seemingly happenstance interactions.
Among the benefits of online conferences, there is the opportunity to record the sessions; this allows participants to review a session that they couldn’t attend due to conflicting schedules for example. The virtual platform also offers the option of closed captioning during sessions. Additionally, the opportunity given to many to attend the conference when they can’t travel and to easily contact other attendees using the “want to meet” feature. Lastly, the virtual format may allow for more interactive material to be presented.
July 2021
Inclusive Makerspace
by Audrey Boklage
What is a makerspace? Simply put, a makerspace is a space where students, faculty and anyone else who is interested can make things. The machines and equipment within makerspaces can range from cardboard and scissors to support early stages of prototypingto 3D printers, CNC machines, and laser cutters. What makerspace participants actually make is also flexible. Products can range from keychains printed for birthday gifts to high resolution prototypes that are eventually patented and the foundation of a startup. The University of Texas at Austin is home to Texas Inventionworks, an academic makerspace housed in the Engineering Education Building. This space is one of a kind in its sheer size as well as its approach to incorporating the use of a makerspace into existing engineering curricula.
Within the Center for Engineering Education at UT Austin, our research is focused on how to design, implement, and support inclusive environments in makerspaces. We are interested in welcoming anyone with any level of expertise into the doors of not just Texas Inventionworks, but all academic makerspaces across the country. Our research has identified promising practices for incorporating class projects that utilize the makerspace in existing engineering curricula. The inclusive practices include:
• Increasing visibility including how people learn about the makerspace as well as signage within the space
• Integrating the makerspace throughout the curriculum such as class projects
• Encouraging interdisciplinary collaborations across departments as well as between students and faculty members
• Incorporating culturally relevant making through curriculum and showcasing student projects and work
• Deliberately designing space to encourage collaboration through group workspaces as well as the elimination of physical barriers (e.g., backpacks on chairs)
• Promoting inclusivity through the physical space perhaps through thinking through a student experience of entering the space for the first time
• Fostering a risk-taking, fail-forward culture through encouraging students to take risks while lowering the material costs for using the space
• Increasing accessibility for students with different abilities
• Increasing accessibility through time that the space is open
• Hiring and training student techs and staff to develop a sense of belonging and encourage inclusivity
Currently, our research is exploring how to support students who work in university makerspaces in the creation and implementation of inclusive environments. Additionally, we are embarking on a five year project to develop a theoretical framework to take a critical look at who is actually working in makerspaces and how these individuals are interacting. This research will eventually inform pedagogical tools such as student and faculty training as well as inform hiring practices to support inclusive practices When we aren’t tinkering or reading about the exciting work of university makerspaces, you can find our research team finding inspiration from the great outdoor spaces of Austin to inform our next design project. Let us know if you’d like to discuss what we’re seeing in these spaces to support students and how we can help you design inclusive environments for your makerspace stakeholders.
June 2021
Systematic review –search and selection process
by Maya Denton
One of my first projects in grad school was working on a systematic review, which I found incredibly valuable. I gained such a good understanding of our topic of interest and enjoyed the methodical process of going through the steps of a systematic review. Here are a few things I learned about the search and selection process of systematic reviews:
1) Use a mix of technical and social science search databases: Since engineering education is so interdisciplinary, an interdisciplinary mix of databases is needed to capture articles across different types of journals and conferences. Technical journals will sometimes publish education-focused articles specific to their discipline. My recommendation is including at least two technical and two social science databases during your search.
2) Google Scholar is a great search database: I cannot recommend Google scholar highly enough. While it is not a typical search database, Google scholar will often capture relevant articles that would be missed in other databases. The only caveat is, there will also be more irrelevant articles that you need to sift through to get to the relevant ones. Dependent on the scope of your topic, you can choose to use Google scholar to supplement your search or be one of your main search databases.
3) Keep Yes, No, and Maybe folders of downloaded PDFs: Folders helped me keep the massive amounts of papers I downloaded in check, as well as organize my thought process related to inclusion. I kept papers I was unsure about in the Maybe folder, which had subfolders organized by reason I was unsure (i.e., topic might not be central to study, topic only mentioned in discussion, etc.). If I rejected an article for inclusion, I moved it to the No folder and placed in a subfolder category for rejection(i.e., paper not related to STEM, paper not empirical, etc.).
4) Use Excel or another tool to keep track all files and file details: During the search and selection process, I kept an organized Excel file with all paper information (article type, author, year, title) and inclusion status, recording detailed notes about the maybe papers. To keep the document manageable, I only added papers that made it through the first round of screening as yes or maybe. I worked with my collaborators to make final decisions about paper inclusion, who read through my notes and all the maybe papers. An alternative to file folders and Excel would be to use citation management software such as Zotero, Mendeley, or EndNote.
5) Pace yourself and set weekly goals: Depending on your topic, there may be a lot of papers to review and databases to search with different terms. Map out daily or weekly goals to keep yourself on track. Take a break when the papers start blurring together! Sometimes you need to take a walk or work on another project to look at the review papers with fresh eyes.
Systematic reviews are helpful for when you start a new project or are interested in a particular area of study. It will help you with future projects on the topic and make writing futurelit review and discussion sections much easier!
May 2021

Encouraging People to Discuss Sensitive Topics
by Brandon Bakka

and
by Vivian Chou
Qualitative interviews and focus groups are one of the most widely used tools for understanding student experiences and the climate in STEM. These discussions provide researchers a rich vignette of individual student emotions and experiences within a certain environment. However, for students with marginalized identities, it can be very difficult to discuss sensitive or traumatic experiences with an interviewer. This begs the question, how can we as researchers encourage interviewees to share their personalexperiences with us?As queer researchers studying the experiences of queer STEM students, we are aware of the difficulties that come with opening up to a relative stranger, particularly when one’s queer identity carries the risk of backlash or intolerance. To this end, we have compiled a few different interview strategies to encourage students to share their authentic experiences.
● Provide options for anonymous interviews: In addition to the traditional face to face (or virtual face to virtual face) interviews and focus groups, we provided students with options to remain anonymous. Students were able to use their personal email address and/or their personal Zoom account. Students were never required to provide their name or other identifying information, and they did not have to have their camera on during the video call. We also offered students the option to conduct interviews fully via a messaging platform if they were uncomfortable or unable to discuss their experiences verbally
● Demonstrate you are an ally, both explicitly and implicitly: We chose to begin each interview with an introduction of our identities, pronouns, and a discussion of why we were passionate about this particular topic. We then invited each interviewee to provide their names, pronouns, and any relevant identities as they felt comfortable. We used our script introduction to showcase that we wanted to hear their experiences as allies to their marginalized identities. Additionally, implicit messages of support can also be highly impactful. For instance, one interviewer could have their pride flag in view of the camera to show support.
● Provide a comfortable and private interview space: If meeting with students in person, it is advisable to select a neutral third-party location for the interview (i.e not your office, or a place in the students major building). You could even ask the student to suggest a location they feel comfortable meeting in as well. When conducting an interview over video, remember to reserve a location for the student toconduct their portion of the interview. Make sure to provide a private space away from family members, roommates, or other students. Additionally, you could provide students with the interview questions or discussion points ahead of time so they can adequately prepare to discuss any topics that are difficultfor them. This also provides them the chance to decline to discuss particular subjects they are not comfortable with ahead of time.
These strategies serve as good starting places to encourage interviewee(s) to freely and comfortably discuss their experiences with the interviewer(s). Furthermore, we have found thatfor invisible marginalized communities, such as the LGBTQ+ community, conducting focus groups can actually be a way to build community acrosscampus. Interviewees are eager to share their experience and provide a voice to their marginalized communities. Therefore, we must take proactive steps in fostering a positive relationship between us and the interviewees to better understand marginalized students’ experiences.
April 2021

Keeping Data Organized
by Sneha A. Tharayil
After five years of reading countless academic journal articles recounting the details of the various fascinating and landmark studies that inform our field today, it was easy to fall into the perception that the process of research follows the orderly format typical of many empirical papers: 1. Ask your research questions; 2. Review the literature; 3. Formulate hypotheses; 4. Choose an appropriate methodology; 5. Collect your data; 6. Analyze your data. 7. Present your results/findings. 8. Discuss your findings and offer some conclusions. Yet, even though, somewhere in the recesses of my mind, I theoretically “knew better” that research rarely ever happens in such an orderly fact and that it, is in fact, quite messy, when it came to writing my dissertation, I was still surprised to learn just how many hidden steps and processes lay behind the complex and intensive work of doing research.
One “invisible” stage that I wish I paid more attention to when my wiser mentors and peers had talked of it was I what I now call step #5.5. The step in between data collection and analyzing your data. The surprisingly time-consuming yet crucial step of cleaning and organizing your data. For multi-method or mixed-methods studies, this step is especially important because not only are you likely to have more data than you need for any single paper or study, but different types of data will predictably speak to different aspects of your research, different research questions, or simply provide different information. So, all the more reason then, that it is imperative a researcher invest the time and effort, no matter how arduous and tedious, to organize the data corpus. To help manage this process, here’s some potentially helpful tips for organizing data that I’ve learned.
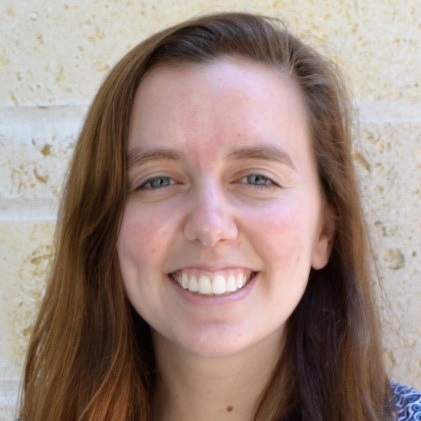
- Create a data inventory: It’s first important to take stock of what data you have exactly and where you have it stored. The more precise your inventory, the more helpful it will likely be. This is to say, when creating your inventory, you want to pay attention to details like: the type of data it is (interview transcript; audio file; survey data; etc.?); the number of individual data files or participants who provided that data; its storage location (either digital or physical) and any details about how to access its location including file paths or password hints or personnel references; the date or stage of research when the data was collected; and any pertinent notes. Of course, if you’re doing research involving human or animal research and there is sensitive information you need to protect, make sure you save your inventory in a secure, private location and it’s best to omit sensitive, identifying information.
- Spreadsheets are your friend: I don’t just say this as someone who has a perhaps inordinate love for spreadsheets, but if you haven’t yet developed an appreciation for spreadsheets, it’s probably time to get acquainted. Spreadsheets are, of course, essentially an organizational scheme and complex calculator built into one magnificent tool. (I like to think of them as digital versions of The Container Store). Inventorying your data using a spreadsheet software (as opposed to a mere word processing document or scribbling it on a piece of paper) will facilitate the process because it will allow you to create efficient tags, that you can later filter, to help you track your data. So, you’ll want to organize the details mentioned in tip #1 into a spreadsheet. Again, the more precise the column headers, the easier to sort. Add a column for a topical tag for each item in your inventory to remind yourself as to which research question or topic the specific data item would most relevant. I would also recommend creating a drop-down menu for this column to help you streamline and categorize your topics a little more. You can also leverage color-coding and fancy conditional formatting features to help you track the status of various data items (ex: whether an interview needs to be transcribed or analyzed, etc.).
Here’s a sample of the inventory I created for organizing my dissertation data, using Microsoft Excel:
- Have a strong name game: It’s amazing how much time you’ll save and confusion you’ll spare yourself if you get into the habit of naming files with a standard schematic, sufficient detail, and again, precision. The file names don’t need to be extravagantly long but it should contain information that will help you quickly determine what’s contained in the file. I usually include details like: author name, content or title of the file, date of origin or date of revision, and any relevant version info (revision number, final draft etc.). In a similar vein, I think it’s equally important to keep files, especially digital files, organized in clearly labeled folders. I’m a big proponent of nested/leveled folders (i.e folders and sub-folders). For example, to organize my interview data, my folder organizational scheme look something like this:
- “2020 Dissertation Interview Data “
- “Student Interview Transcripts”
- “Student A”
- “Student B”
- “Student C”
- (Etc.)
- “Educator Interview Transcripts”
- “Educator A”
- “Educator B”
- “Educator C”
- (Etc.)
- “Interview Audio Files”
- “Student Interview Audio Files”
- “Educator Interview Audio Files”
This schematic might seem like overkill, but I assure you, I waste very little time hunting down a file that I need.
A few final thoughts on keeping data organized:
I’ll be candid and admit that yes, taking time to organize and inventory your data can be tedious and can feel like you’re eating up precious time. However, the time, frustration, and confusion you will save in the long run is worth this initial time-investment. Furthermore, you actually might end up doing much of the important cognitive filtering, refining, and even some of the initial analyses you will inevitably need to do as you sort through your data. The process of getting acquainted with your data and figuring out what information you will actually (and validly) be able to glean from your various data sources is a critical first step in knowing how to proceed with your analysis. It will also help you get a sense of how much time and effort you will need to invest in your analyses. Similarly, even if you don’t end up using all the data you collected, you will still have a nifty tool to come back to later down the line and determine what analyses or new questions can be answered with this data (and where you can find it again). Of course, you’ll want to keep your inventory updated. Finally, it’s worth saying that going through this process can be a nice low-mental energy way to still feel productive and cathartic to realize just how much work you’ve already done on your study. So, go ahead, and congratulate yourself! (Acknowledging these mini-wins is necessary in the endurance effort that is doing research.)
March 2021

Using spreadsheets for qualitative data analysis
by Malini Josiam
You have gathered your data, so now you are ready to tackle the analysis part. With qualitative data, whether it be interview, survey, or observation data, you may feel overwhelmed with figuring out how to start the analysis process. This feeling is totally normal, and this is one approach you can take to make things more manageable.
It can be helpful to keep track of your data using a spreadsheet approach, even if the data is qualitative. Using a spreadsheet to organize your data will lend itself to easier manipulation and visualization potential.
There are several things to consider when using spreadsheets to perform qualitative analysis:
Excel vs Google Sheets:
You should decide which service to use based on what your needs are. Excel has greater functionality when it comes to quantitative functions and data analysis. Google sheets offers less flexibility but can be accessed anywhere and will allow easy, up to date sharing. If you foresee that you will update the spreadsheet frequently while others are also viewing or working on it, it makes more sense to go with Google Sheets. If you anticipate visualizing your data and performing statistical analysis on the data, Excel will be the better approach.
Version Control
It is important to save a raw version of your data in its own tab, if possible, that will remain untouched throughout the analysis process. This way you can ensure that you have at least one location where all the data is, and you have a place to start to redo the analysis if necessary. Create a copy of this tab to begin your analysis.
Setting Up the Spreadsheet
The hardest part about starting a spreadsheet is deciding how to organize the data in rows and columns. Luckily, Excel and Google Sheets are flexible, if you need to change the spreadsheet set up down the line. Take some time to think about what you hope to gain from the analysis to decide how to set up the spreadsheet. If there are many participants or data points, organizing unique data points by row will allow viewing more data for each participant. If there is a lot of data for each participant, using columns for each participant will allow comparison across participants faster.
To make things more efficient in the long run, take time at the beginning to delete rows/columns of data that you definitely will not need. This is more necessary when data is downloaded from Qualtrics or other online survey forms, where IP address and other extraneous data is recorded.
Keeping Track of Themes/Codes
Once you figure out which data you will group by common themes, you can add a row/column next to that data to begin labeling the themes. Recognizing and naming themes is generally an iterative process, so doing this in a spreadsheet means that you can make changes instantaneously. Keep track of themes and examples for each theme that emerge in a separate tab (i.e., your codebook), so you can remind yourself what the themes mean and justify your groupings.
Other tips:
Use filters and conditional formatting to sort through the data quickly
Explore using the data validation tool to create drop down menus for quickly assigning data to themes
Avoid using “other” or “miscellaneous” as a theme. Instead, if you are unsure how to code a data point, move on and come back to it later
Write down your approaches and thought processes as much as possible to remember what steps you have taken in analyzing data 3-6 months later
Use the “freeze panes” command to view the data headers constantly while traversing data points
Tabs are your friend. Start new tabs (sheets) when embarking on a new type of analysis, and when creating figures and tables
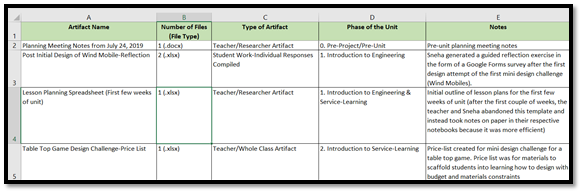
Interview Example:
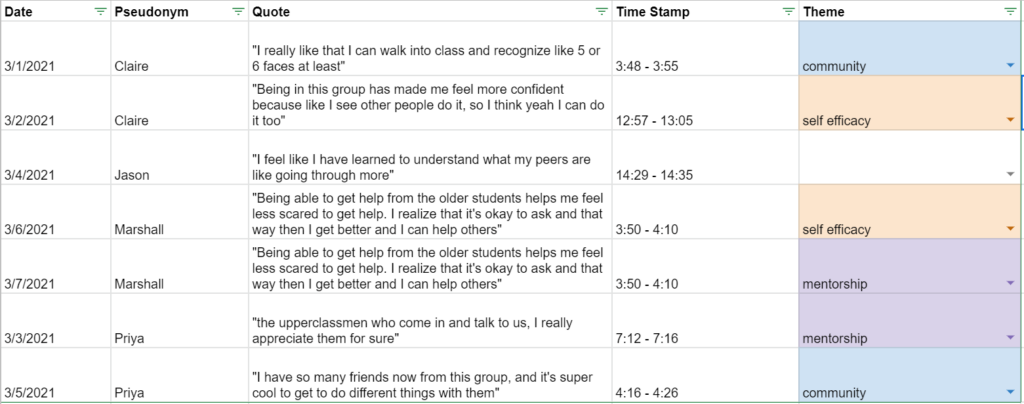
Observation Data Example:
Qualitative data analysis can be overwhelming, but you can ease your fears by taking a spreadsheet approach. Organizing data into rows and columns facilitates organization and will make approaching qualitative analysis feel like more of a linear process.
February 2021
Plan your evaluation plan
by Marialice Mastronardi
When it comes to educational programs, how can we determine if the goals of the program are met, if efforts are paying off and merit further support or if the program needs tweaking and real-time adjustments to increase effectiveness?A robust evaluation plan is the key to a comprehensive understanding of a program, its processes, goals, and outcomes. When designing an assessment for a new educational program, there are several components that should be addressed:
- What is the goal of the evaluation?
If your goal is to have ongoing feedback to make real-time adjustments to the program, then focus groups and interviews of your current participants are an efficient way to collect the needed information. If your goal is to collect data over time, then surveys provide means for recording consistent longitudinal data. When writing your survey for longitudinal data collection, keep in mind that you want to maintain consistency of your questions overtime. You can use already published scales and questions to improve validity and reliability. These two approaches for data collection are not mutually exclusive; used together they can provide a deep understanding of theprogram.
- What are the strengths and the weaknesses of the program? What are the goals of the program?
These are very important questions to answer in order to construct an evaluation plan that fits your needs. Answers to these questions will allow you to determine what to ask and where to focus your attention. Your questions should be as direct as possible. For example, if you want to know if the program had an impact on students’ decision to attend graduate school, ask them simple questions that lead exactly to what you want to know: Are you planning on applying to graduate school? Yes, No, Maybe. Did this program influence that decision?
- Lastly, as the evaluator, be mindful of your biases. You may rightfully be proud of the program, but the ultimate goal of the evaluation is to determine what works and what doesn’t. Your goal should be determining what can be improved and publishing useful findings for other researchers looking to implement a similar program.
Designing an evaluation plan may feel daunting. However, a good way to start is to look in the literature for mentoring texts and evaluations of similar programs. Then set goals and the scope of your evaluation and focus your attention on the information that you want to collect and the collection methods that are appropriate to use.
January 2021

Adjusting to Your Audience: Publishing in a Technical vs. Education Journal
by Anita Patrick
You have done the research, performed the analysis and now are ready to write up your findings for publication. This is a familiar rhythm you will experience throughout your academic careers. As you get more experience with this process, it will become very easy to get accustomed to certain writing styles and conventions. Yet, there are certain affordances to writing for technical content journals and education research journals. These affordances should be considered before embarking on writing for publication.
Picking the right venue for your manuscript will:
- Qualify the length of the manuscript.
Often technical journals have much shorter word limits than education journals which means you will have to tighten up your arguments (such as in presentation of the literature review) and be very concise in the presentation of the results. You will also likely find that technical journals place a lot of emphasis on Tables and Figures to convey information.
- Determine the visibility and impact of your work.
Journals are rated by an impact factor (a measure of how frequently, on average, an article has been cited within a journal in a particular year). Therefore, journals that are prestigious have high impact factors and a large volume of readers.
- Signal to your colleagues and contemporaries the type of researcher you are.
You want to target your audience to the relevant readership which includes your colleagues and contemporaries. Although the visibility and impact of your work is an important consideration, placing your work in the correct venue does not always depend on prestige. For example, if you are interested in a certain area of engineering education such as biomedical engineering education you may decide to publish in a newer journal specific to that discipline as opposed to more established engineering education journals.
As a researcher, picking the correct journal can be a bit overwhelming. A good rule of thumb I have followed is that if I enjoy articles published in certain journals I endeavor to publish there while also looking out for opportunities to collaborate with my colleagues to contribute to special issues and newly founded journals in my area of research.
Do good work and have fun!