INTRODUCTION
Texans 65 and older make the overwhelming share of their daily trips in a private vehicle, most often as the driver, and more so than comparable seniors in the rest of the country. Senior Texans, conversely, walk and use public transit far less than comparable U.S. seniors. Are these differences cultural or are they explained by where Texans 65 and older live and the nature of their neighborhoods? Texas seniors, as a group, largely live outside of dense city cores in low density suburban and rural neighborhoods. These kinds of neighborhoods are often associated with a greater reliance on a private vehicle. Conversely higher density and mixed use neighborhoods are generally associated with greater use of alternatives to the car, because the combination of density and multiple destinations makes walking, cycling, and public transit more feasible, while simultaneously making driving less attractive due to increased congestion and higher parking costs.
Does the low density and residential nature of their neighborhoods explain why Texas seniors drive more than their peers? Or do Texans simply enjoy the freedom and convenience of driving themselves, enough to accept increasing traffic congestion, longer commutes, the costs of owning and maintaining multiple household vehicles, and substantial parking fees? We used unpublished data from the 2017 National Household Travel Survey (NHTS) to examine these questions.
We found that Texans 65+, men and women, were simply not as responsive to the density of their neighborhoods as were comparable seniors nationally. The percent of the trips Texas seniors take driving a private vehicle* declined very little with increasing residential density. particularly for men; the impact was really only noticeable at the very highest density. Residential density, moreover, didn’t well explain differences between senior women and men anywhere, nor between senior women in Texas and comparable women in the rest of the nation. Rising residential density was better at explaining the use of public transit but only at the very highest density.
Why didn’t we see a meaningful difference in driving as density increased among Texas seniors? And what does it mean? Our findings may be partially the result of the way the NHTS density data are categorized. But two other possibilities also stand out: there may be important variations in land use patterns and transit options in neighborhoods of comparable density across the country, and, there may be real cultural differences in how Texas seniors, particularly men, view the importance of owning and driving a car. The bottom line is that there is some evidence that Texas seniors, particularly men, really do love driving their cars more than comparable seniors nationally.
THE NHTS AND DENSITY MEASURES
The 2017 NHTS gives us the opportunity to examine the travel patterns of senior drivers in Texas and across the nation, questioning the relationship of residential density to mode choice. It contains the latest detailed data available on the travel patterns of US residents. The NHTS asked a large national sample of Americans about their travel patterns—where, when, and how they made trips; it also included a special “add-on” for the entire state of Texas. The NHTS characterized the nature of the neighborhood in which the respondents lived in a number of ways, including population density; to do so the survey used a proprietary classification approach—the Claritas system. Claritas characterizes every census block in the nation as falling into one of 99 centiles. The lowest centile, 0, is composed mostly of the Census blocks with the lowest population density in the U.S. The highest centile, 99, is composed mostly of Census blocks with the highest density in the country.* The centiles are thus relative and not absolute; think the Mojave Desert on one extreme and Manhattan (NY) on the other.
The Claritas system then categorizes these centiles into five categories, ranging from the lowest to the highest density cluster of Census blocks. The system also differentiates two categories of centiles of the same density by characterizing those that are part of what it labels suburban and second city neighborhoods:
- Rural = 0 – 20th centile
- Small Town = 20 – 40th centile
- Suburban = 40 – 90th centile
- Second City = 40 – 90th centile
- Urban = 75 – 99th centile
Table I compares the distribution of the population of Texas seniors to the national distribution of seniors across these categories (without Texas included). A smaller share of Texas seniors lives at the lowest—rural and small towns—densities. Slightly more than a third of Texas women and men over 65 live in rural areas and small towns compared to over 40% of comparable seniors in the rest of the nation. A smaller share of Texas seniors also lives in the highest density, urban, areas. Texas seniors are more likely to live in suburban areas and second cities, as Claritas characterizes them than their national counterparts; roughly 50% of Texas seniors live in these residential areas compared to only 40% of seniors nationally.

POPULATION DENSITY AND SENIOR TRAVEL BEHAVIOR
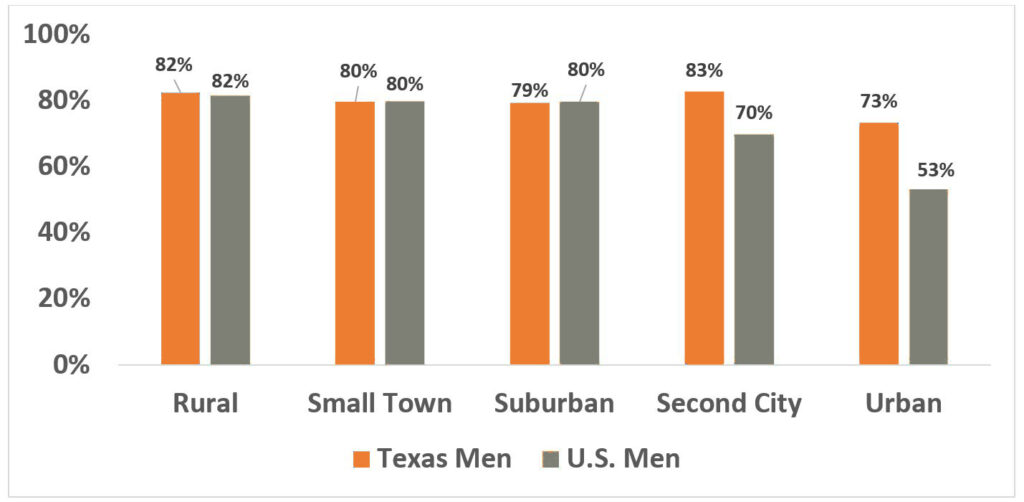
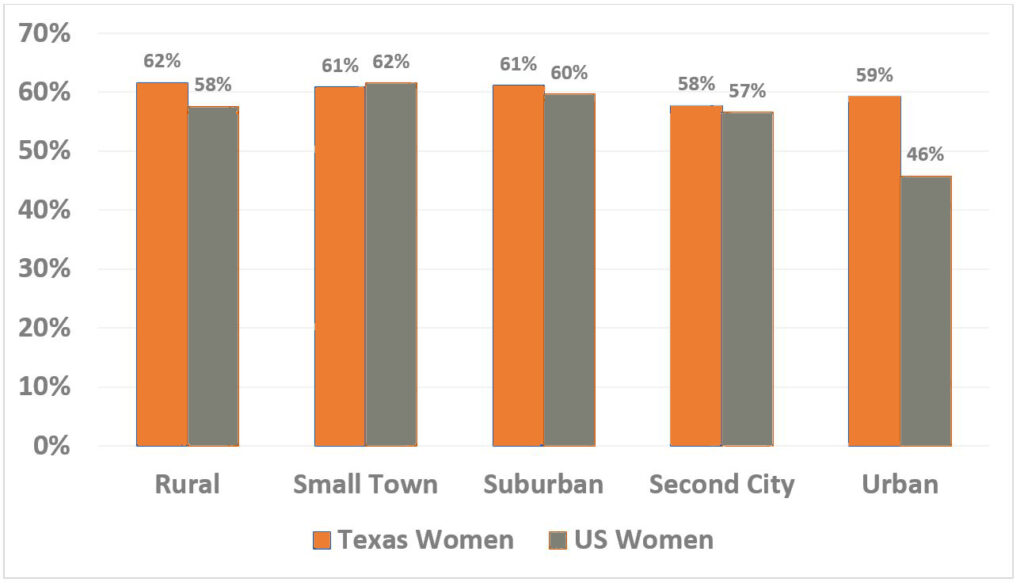
Figure I a and I b allow us to see the outlines of the relationship between population density and senior travel choices nationally and in Texas—and to observe some important differences by sex. These figures make clear that the decision to drive by Texas men 65+ is far less responsive to higher density than are the comparable decisions of their U.S. counterparts. It is equally clear that senior women are fairly unresponsive to increased density except at the highest level.
Figure I a compares the percent of all trips taken by men 65 and above driving a personal vehicle (a car, light truck, SUV, etc) in Texas and in the rest of the United States (without Texas) in 2017. It is clear that there are miniscule differences at low densities; senior men in both Texas and the nation are driving for roughly eight out of every ten trips they make when living in rural, small town, and suburban neighborhoods. The important differences start in second city residential neighborhoods where the percentage of trips taken by driving increases slightly for Texans while declining for comparable men in the rest of the nation. The largest and most obvious difference is in the highest density, urban, neighborhoods where there is a 20 percentage point gap between Texas senior men and those in the rest of the country. In short, the travel choices of Texans appear far less sensitive to density than their counterparts nationally who only drive for a little over half of their trips in urban areas.
There are fewer differences between senior women in Texas and those in the rest of the nation, and far less response to increasing residential density than comparable men. Figure I b shows that most women make roughly six out of ten trips driving a car whatever the density of the neighborhood in which they live and whether they’re Texans or not. The drop in driving as residential density increases is only seen among Texas women in second city neighborhoods and the response is very small. It’s striking that more Texas women 65+ actually drive in the highest density neighborhoods than in second city areas—that is driving increases slightly as density increases. The only important response to density by women 65+ in the rest of the United States is at the very highest residential density, in urban areas, where senior women make under half of all trips driving.


It’s important to note that women actually make almost as many trips in a private vehicle as men—they are just far less likely to be driving the vehicle in which they’re riding than comparable men. Figure II shows that women 65+ make from a fourth to a third of all their trips as a passenger in a private vehicle; their propensity to be the passenger tends to decline with increasing residential density, There are no marked differences between Texans and comparable senior women in the rest of the U.S. except for those living in suburban neighborhoods, where there is a 9 percentage point gap with senior women in the rest of the nation more likely to be a passenger.

Texas men 65 and over are overall less likely to ride as a passenger as density increases; both those living in rural neighborhoods and those living in the highest density, urban, neighborhood make roughly 11% of all trips as passengers. These patterns are in marked contrast to those of senior men in the rest of the nation; riding as a passenger overall rises with increasing density to the point where a) the patterns of these men and all women are roughly comparable, and b) they are making one out of five trips as a passenger in a private vehicle.
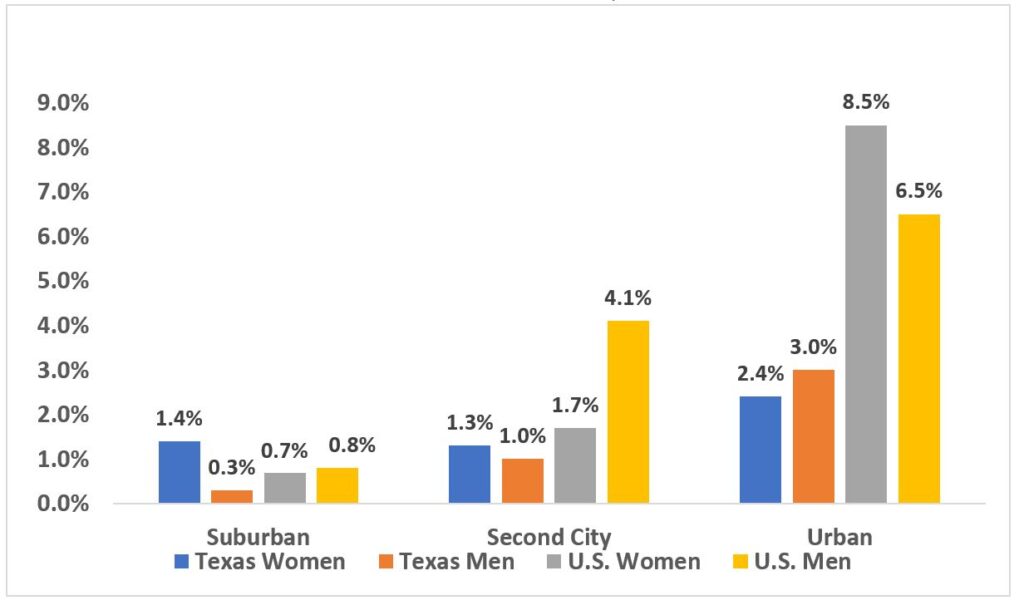
Finally Figure III shows how public transit use is influenced by residential density; the figure shows only three density categories because there is very limited public transit services in rural and small town residential areas. Transit use generally does go up for both Texas seniors and those in the rest of the U.S. as residential density rises—but the rate of increase is small and there are meaningful differences between the two groups. No more than 2.4% of the trips of Texas women 65+ are made using public transit, and that in the highest density, urban neighborhoods. This is not much of an increase over the 1.3 – 1.4% of trips these women make using public transit in suburban and second city neighborhoods. Texas men 65+ make more of their trips by public transit than comparable women in urban neighborhoods but the share is also small—just 3% of all trips.

The Texas patterns are in sharp contrast to those of the rest of the nation. Public transit use rises with density for both women and men nationally but much faster and higher for men than women; over 8% of all trips of men and 6% of all trips of women 65+ in the rest of the nation are taken using public transit in urban residential neighborhoods. Public transit use among Texans 65+ of either sex is not nearly as responsive to increases in density as it is for their national counterparts; there’s a 4 percentage point gap between Texas women and a 5.5 percentage point gap between Texas men and their counterparts at the national level at the highest residential population density.
These analyses suggest that residential density alone, at least as measured by the Claritas system, does not unambiguously explain differences in the use of private vehicles or public transit by Texas seniors and their national counterparts. Nor does density clearly explain the travel differences between women and men and between women 65+ in Texas and comparable women travelers across the U.S. Density is particularly ineffective in explaining women’s behavior, particularly the fact that they are more often a vehicle passenger rather than a driver (especially given that over 80% of senior women have a drivers license in both Texas and the nation). Residential density is better at explaining differences in the use of public transit, but often only at the highest density.
POLICY IMPLICATIONS
These findings suggest three possible perspectives on the impact of residential density on the differential travel patterns of Texas seniors and comparable seniors nationally. First, the Claritas categories are large and overlap AND Texas has inherently lower residential density even in the core of the major cities than much of the rest of the U.S. Texas seniors may therefore be clustered in the lower density end of the three most dense categories (for example at a centile in the 40’s or 50’s as opposed to the high 90’s). So Texas seniors may not actually be making different travel decisions than really comparable seniors nationally who live at the same density—it may be that the impact of density is lost in the overaggregation of Claritas categories.
Second, neighborhoods of roughly equal residential density may be very different in different parts of the country. It is possible that a suburban census block in Baltimore or Portland or St. Louis may have more shops and restaurants and public transit options than an otherwise comparable suburban census block in Houston or Fort Worth or Austin. Residential densities, in other words, may be a poor measure of the availability of local shopping and social destinations, pedestrian or cycling infrastructure, and public transit alternatives.
Third, Texas seniors, particularly men, may really like to drive more than comparable seniors in the same kinds of residential neighborhoods in the rest of the country. Indeed increasing density was slightly likely to be associated with decreasing auto use among Texas seniors but the drop in driving by Texas seniors at even the highest density was nowhere near the change in driving among seniors living elsewhere as density increased. Conversely, Texas women 65+ acted more like comparable women nationally than did Texas men 65+, neither group being very responsive to increased density. There is no way around the compelling evidence that density doesn’t impact women 65+ with the same intensity or regularity as it does comparable men in Texas or nationally.
It seems likely that all three factors are at work in explaining the patterns in the data; they may interact in ways that create the greater dependence on the private vehicle, even at higher density, seen among Texas seniors, particularly men. Our analyses do suggest, however, that male Texas seniors are more likely to drive themselves for their overall travel needs than their national counterparts, being far less but not totally unresponsive to the density of their neighborhood. So perhaps culture does play an important if not exclusive role in the travel decisions of Texas seniors—they just love their cars.
REFERENCES
We prepared the data in the tables and figures in this Brief from previously unpublished 2017 NHTS data.
*A private vehicle is a personally owned car, SUV, or light truck used largely for personal travel. The data do not include the trips made by the same vehicle if/when used to provide ride share services (like Lyft and Uber) or used for commercial purposes.
