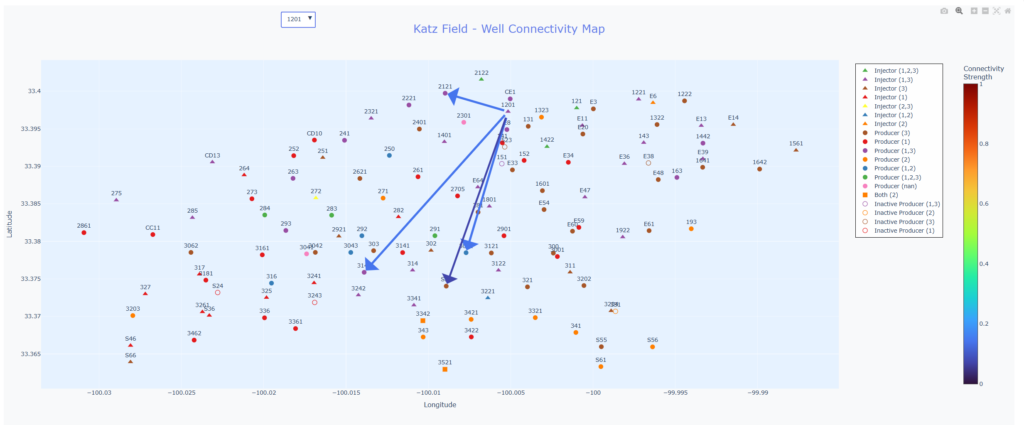
Where does injected water actually go in a field with three stacked reservoirs and no downhole meters?
Interwell connectivity analysis of the Katz (Strawn) Field, Stonewall County, Texas, using the Capacitance-Resistance Model.
Background
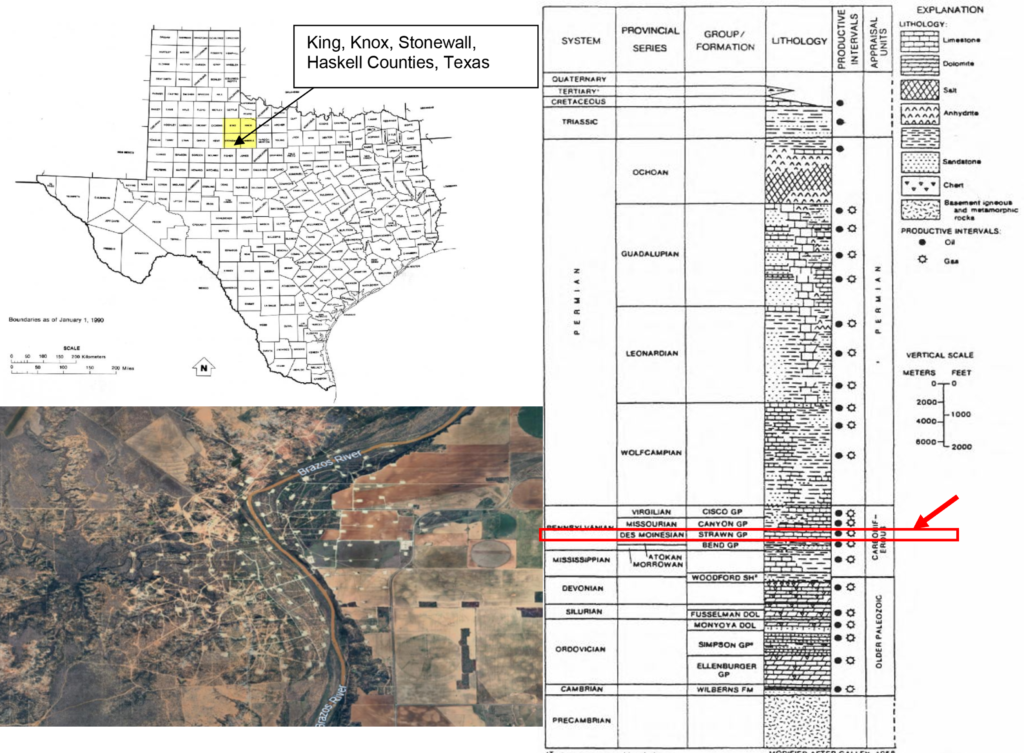
The Pennsylvanian (Desmoinesian) Strawn Formation along the eastern shelf of the Permian Basin is known to contain abundant oil/gas in both carbonate and siliciclastic reservoirs. The Katz Field found in northeast Stonewall County, TX is a siliciclastic-dominated play that also contains minor carbonate. The Katz is a complex “facies mosaic” of sandstone, siltstone, mudstone, and crinoid-rich grainstone deposited within the extensive Haskell Delta System in the Pennsylvanian. Depositional environments include proximal to distal tidal deltaics and associated tidal shelf deposits Permeability, the ability for fluid to flow between grains, changes rapidly over short distances. This geological complexity that can be broken down into manageable “layers” or zones” for fluid flow modelling purposes, combined with an extraordinary 70-year production history involving waterflooding and CO₂ injection, makes Katz a perfect natural laboratory for developing subsurface reservoir models. With a dense, closely spaced grid of over 150 wells the field also provides a relatively high-resolution data that is rarely available for Eastern Shelf oil/gas fields . My research leverages this unique dataset to test and refine the Capacitance Resistance Model (CRM), allowing us to map inter-well connectivity in heterogeneous siliciclastic systems where traditional models often struggle.
Overview
The Katz (Strawn) Field
The Katz (Strawn) Field represents a mature Texas reservoir with an extensive history of operations. The Katz (Strawn) Field was discovered in 1951, waterflood operations were initiated in 1984, and more recently shifted to CO2 EOR operations in 2010. This reservoir evolution has created an array of opportunities to observe reservoir behavior during different stages.
Geological Setting – Located in North Texas, the field has its source of production from the Pennsylvanian Strawn Formation, a complex geological system of multiple stacked sands from the Haskell Delta System, trending from the northeast. Complex field architecture is presented by three main zones of production, consists of sands at 4800′, 4900′, and 5100′, these zones are often commingled in production.
The key idea
Completion diversity substitutes for downhole measurement.
Katz wells are perforated in differing subsets of the three zones. A producer open to only one zone can respond only to injection entering that zone, so pairs sharing a single perforated zone identify that zone’s connectivity. Pairs sharing no zone at all provide a check, because their expected connectivity is zero. Taken together, the overlapping completion subsets make the zonal connectivities identifiable from commingled rates.

Research objectives
- To characterize reservoir heterogeneity using CRM to analyze production and injection changes.
- To integrate geological constraints with engineering signal processing (CRM).
- To optimize future waterflood and Enhanced Oil Recovery (EOR/CO2) strategies based on zonal connectivity.
Methodology
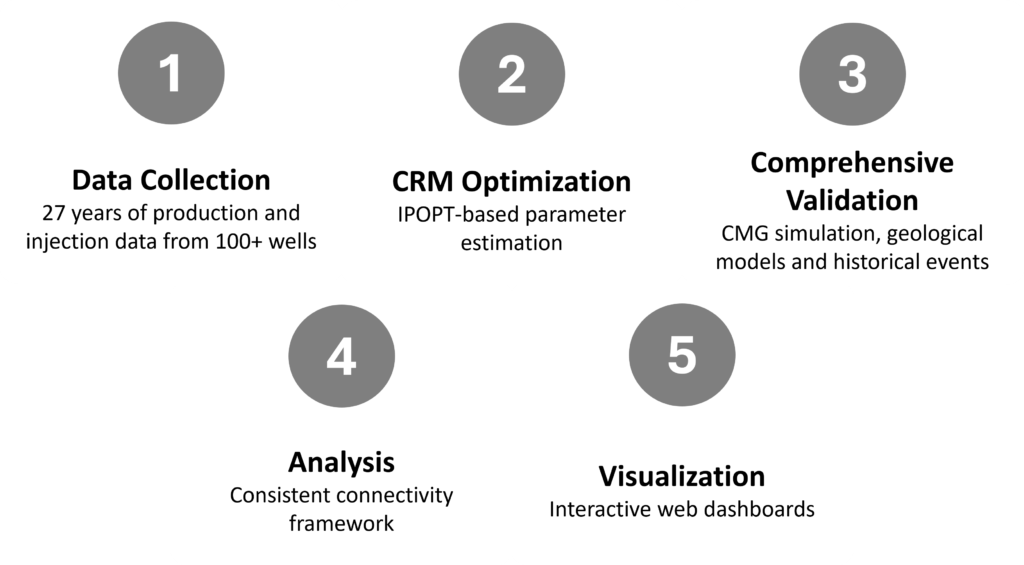
Research workflow
Findings
- Two flow regimes
- The zonal view of the field sees what a field-wide fit hides
- Rate data can locate small faults
- Unexplained cross-zone connectivity
Why Integrate Geology?
By integrating geological constraints (e.g., faults, pinch outs) into the CRM workflow, we can eliminate unrealistic connections and derive a model that better represents the subsurface.
Engineering data tells us where fluid is moving, while geology explains why. Relying on engineering data alone often yields “non-unique” solutions mathematically correct but physically impossible results.
Limitations
Applying this method to the Katz Field presented unique hurdles typical of mature assets
- Data scarcity, decades old completion and rate records were often vague, had errors or missing.
- Operational noise, distinguishing between true reservoir responses and operational fluctuations over a 20+ year history.
- Commingled production, production comes from three distinct stacked sands (4800′, 4900′, 5100′), making it difficult to isolate which zone is contributing to flow.
- Connectivity estimates are not unique, so a good rate match does not establish a single true solution.
- No bottomhole pressure data were available.
- The 16-year analysis window sits near the lower edge of the range considered statistically reliable. Zonal attribution rests on perforation records, which show where a well is open rather than where it flows.
- The geological comparison is only as firm as the isopach and fault maps, which carry their own uncertainty where core and log coverage is sparse.
Key Contributions
This research tackles the challenge of understanding fluid flow patterns in mature oil fields. By developing high speed analytical tools, we can identify which injection wells are connected to which production wells critical information for optimizing waterflood and EOR operations.
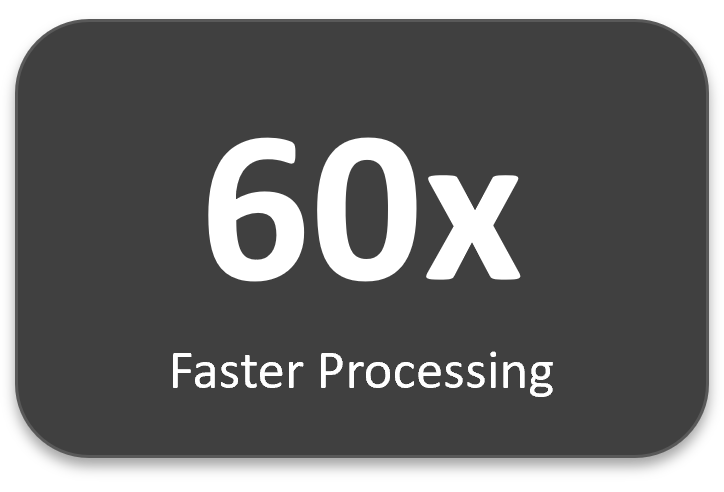
- High Speed Optimization Framework – Implemented the open-source Interior Point Optimizer (IPOPT) to reduce full-field connectivity analysis runtime by 98% (relative to SciPy’s optimizer).
- Interactive Visualization Platform – Built Python-based dashboards (Dash/Plotly) to interactively track well performance and connectivity, reducing data interpretation time for the engineering team.
Tools used in this study
- Interactive Well Performance Dashboard
Follow the link below to access the well dashboard
https://katz-field-dashboard.onrender.com (server loading time 1 minute)
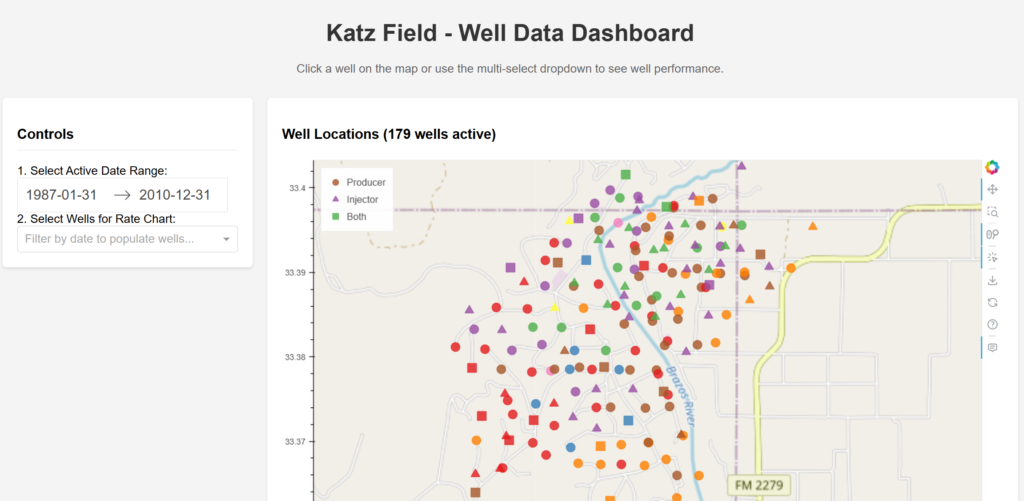
Features,
- Interactive map with OpenStreetMap integration
- Click wells to instantly view performance history
- Multi-well selection for comparative analysis
- Combined rate charts for field-wide trends
- Date range filtering (1984-2010)
- Zone-based color coding (Multilayered reservoir)
- Real-time data visualization with Plotly
2. Connectivity Visualizer
The following link provides access to the visualization tool for interpreting interconnectivity results from the Capacitance-Resistance Model (CRM)
https://katz-connectivity-visualizer.onrender.com