
This test is used to determine if two categorical variables are independent or if they are in fact related to one another. If two categorical variables are independent, then the value of one variable does not change the probability distribution of the other. If two categorical variables are related, then the distribution of one depends on the level the other. This test measures the differences in the observed conditional distribution of one variable across levels of the other, and compares it to the marginal (overall) distribution of that variable.
Conditional vs. Marginal Distribution
A conditional distribution is the distribution of all levels of one variable given that the other variable equals some value. The marginal distribution is the overall distribution of one variable, ignoring the other.
For example, take the following data:
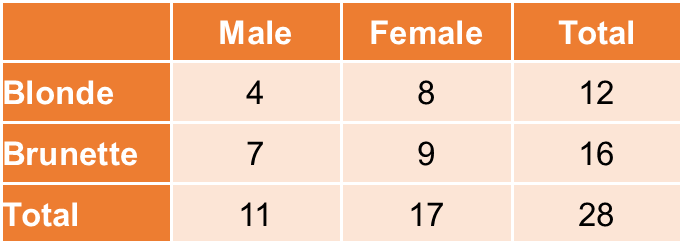
The marginal distribution of hair color is 43% blonde/57% brunette. The conditional distribution of hair color for women is 47% blonde/53% brunette, while the conditional distribution of hair color for men is 36% blonde/67% brunette.
The chi-square test of independence will determine whether the differences between the conditional and marginal distributions are significant, or if they are small enough to be expected simply by random chance.
Assumptions:
- Random samples
- Independent observations
- The sample size is large enough such that all expected frequencies are greater than 1 and at least 80% are greater than 5.
If your data fails the sample size assumption, try collapsing categories to increase the expected frequencies. If that is not possible, an alternative test is Fisher’s Exact test.
Hypotheses:
Ho: The variables are independent.
HA: The variables are not independent (meaning they are related).
Relevant Equations:
Degrees of freedom: (number of rows – 1)*(number of columns – 1)
Expected counts for each cell: (row total*column total)/grand total
![]()
Example 1: Hand calculation
This video analyzes if treatment group and symptom status are independent for participants in a randomized drug trial.
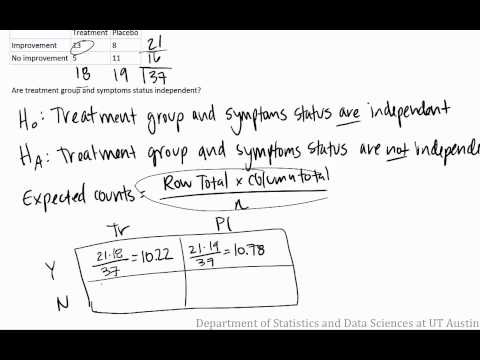

Sample conclusion: After checking the assumptions of random sampling and noting that none of the expected counts for our data were less than 5, we completed a chi-square test of independence to determine if treatment group and symptom status are independent. We failed to reject the null hypothesis and found evidence that treatment and symptoms are independent (X2 (df=1)=3.42, p>.05).
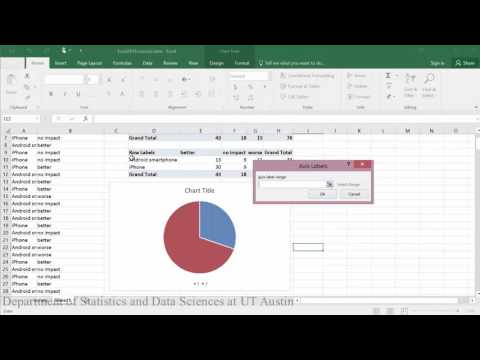
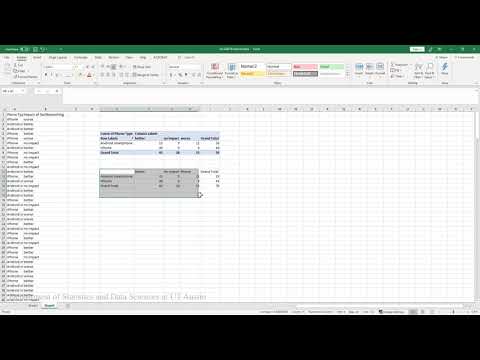
Example 2: Performing analysis in Excel 2016 on
These videos analyze if phone type and beliefs about the impact of social media are independent.
To calculate a chi-square test in Excel, you must first create a contingency table of the data. The first video below describes this process. The second video runs the chi-square test.
Creating contingency tables and pie charts:
PDF corresponding to video
Creating contingency tables and stacked bar charts:
PDF corresponding to video
Performing the test of independence:
PDF corresponding to video
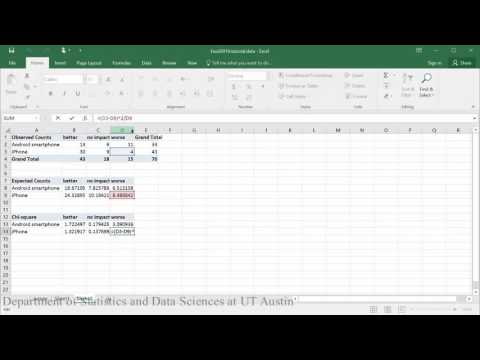
Sample conclusion: After checking the assumptions of random sampling and noting that none of the expected counts for our data were less than 5, we completed a chi-square test of independence to determine if phone type and beliefs about the impact of social media are independent. We rejected the null hypothesis and found evidence that that phone type and beliefs about the impact of social media are not independent (X2 (df=2)=8.82, p=.01).
Example 3: Performing analysis in R
This dataset contains information about musicians who have performed on ACL Live, and this video analyzes if the categorical age of these artists (20s, 30s, etc.) is related to whether or not they’ve won a Grammy.
Dataset used in video
R script file used in video
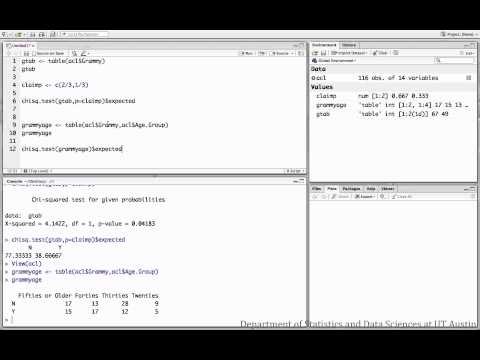
Sample conclusion: We have no evidence to suggest that winning a Grammy is related to age group for the artists performing on ACL Live (X2 (df=3)=5.54, p>.05).