
A logistic regression model can be run to determine if one or more predictors explain variation in a categorical outcome. The most common logistic regression method (covered here) is binary logistic regression, which is run on a dichotomous outcome variable. The category of interest (sometimes referred to as a “success”) is coded as 1 and the other category (“failure”) is coded as 0. For example, if you are interested in whether or not a drug is effective at reducing nausea, patients who experienced a reduction in nausea would be coded as 1 and those who did not experience a reduction would be coded as 0.
Logistic regression is a type of generalized linear model, meaning that a link function (the logit) is applied to the outcome variable to estimate the effect each predictor variable has on the probability of “success” in the outcome variable.
Logistic Model Equation (for k predictors):
![]()
Each coefficient estimate from a logistic regression is the [tooltip tip=”log base e“]natural log[/tooltip] of the [tooltip tip=”the probability of success divided by the probability of failure.”]odds of a “success.”[/tooltip] Typically, the estimates for each predictor are exponentiated and reported as [tooltip tip=”odds of one group divided by odds of another group”]odds ratios[/tooltip] for ease of interpretation. For example, suppose your outcome variable is whether or not a dog gets adopted from an animal shelter and your predictor variable is whether or not the dog is a puppy. The model results might look something like this:
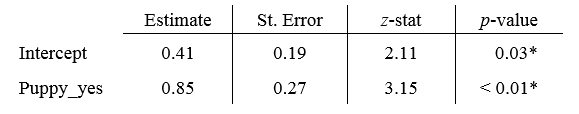
To interpret the estimate for Puppy, you would calculate e0.85 = 2.34 and say that if a dog is a puppy, the odds of being adopted are 2.34 times higher than a dog that is not a puppy (z = 3.15, p < 0.01).
Hypotheses: Each predictor will have its own set of hypotheses:
Ho: Controlling for all other predictors in the model, this predictor variable does not explain variation in the outcome.
HA: Controlling for all other predictors in the model, this predictor variable does explain variation in the outcome.
Assumptions:
Note: If your outcome variable has more than two values, other options for analysis include ordinal or multinomial logistic regression.
Example 1: Performing a binary logistic regression in R
Dataset used in video
R script file used in video
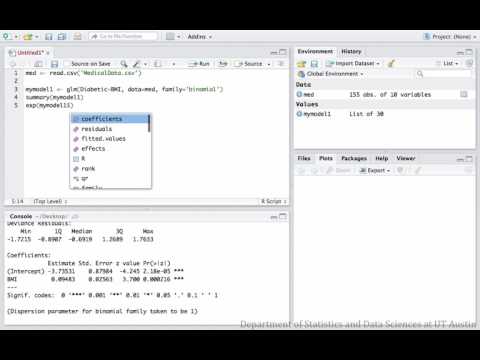

Sample conclusion: An increase in BMI leads to an increase in the probability that a patient has diabetes (z=3.7, p<0.001). The odds of a patient having diabetes increase by 9.9% for every unit increase in BMI.