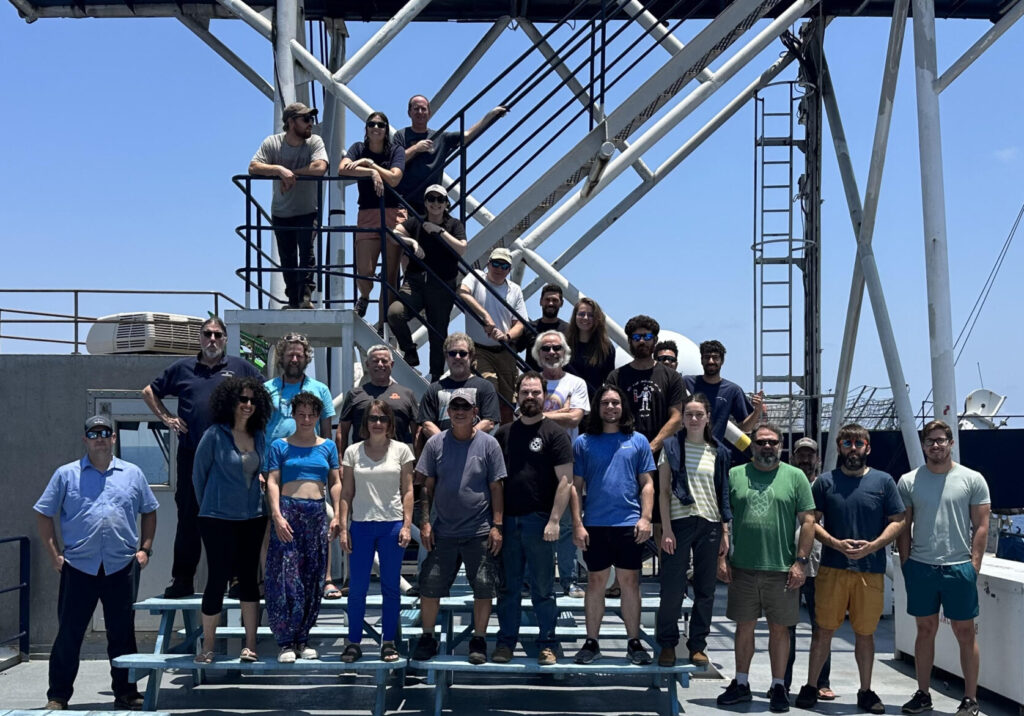
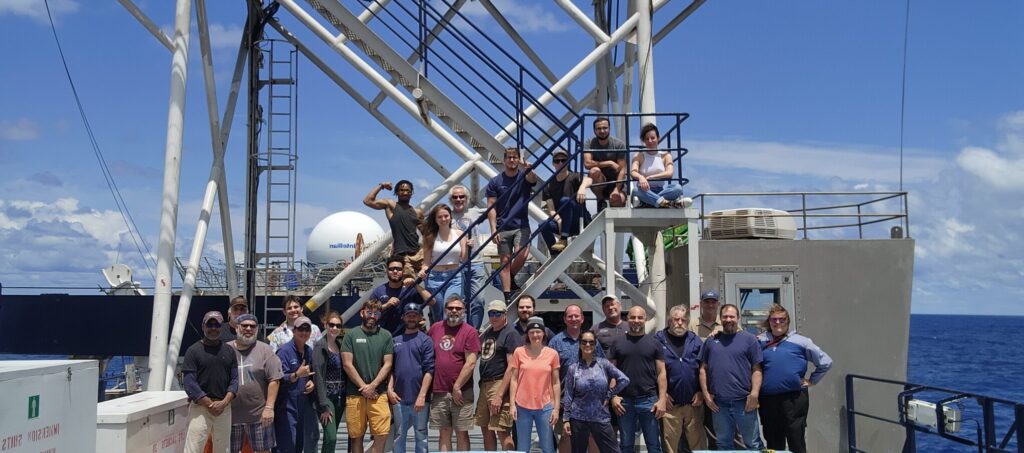
This trip has been memorable to say the least. Some of us were new, learning what changes the sea can require of you, while also getting our hands on in-field data acquisition for the first time. Others have made this kind of trip multiple times and were there to help the rest. We found wonderful data and got through a lot of sampling. There were also opportunities to help out the Langseth crew, especially while coring. But now, its time for plenty of tired bodies and minds to get back home. We wish our international team members safe trips back and a huge thank you to all of the people who keep this ship running. Finally, thank you to everyone who has taken the time to engage with this website. This trip wouldn’t have been complete without getting to share it with everyone.
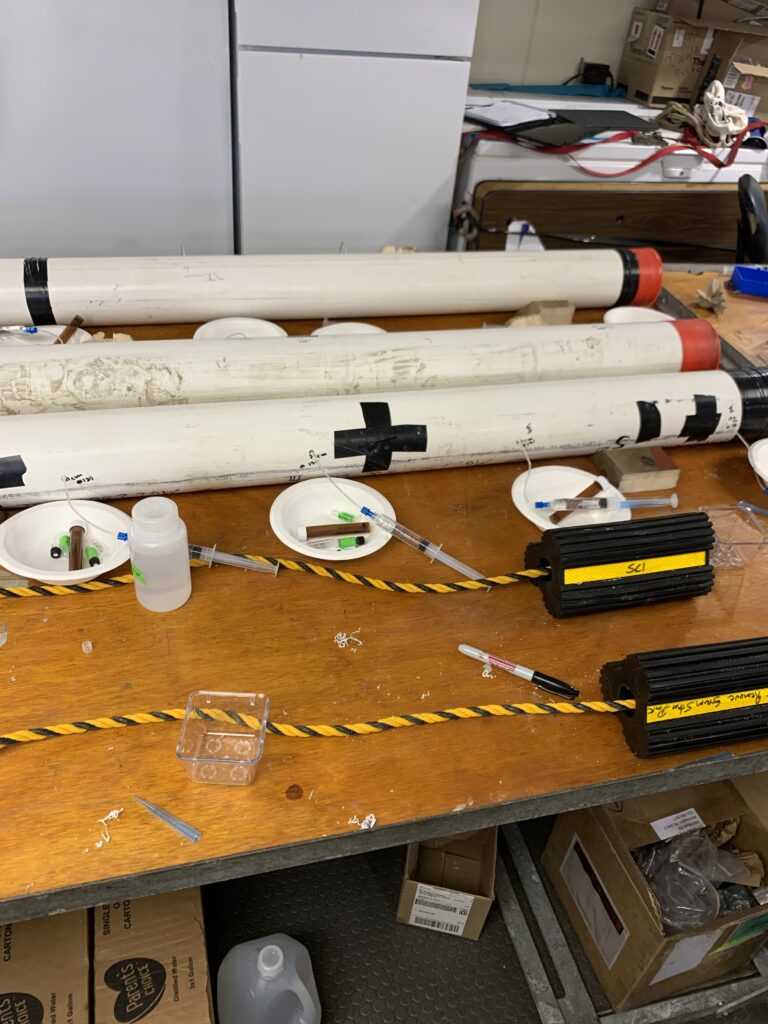
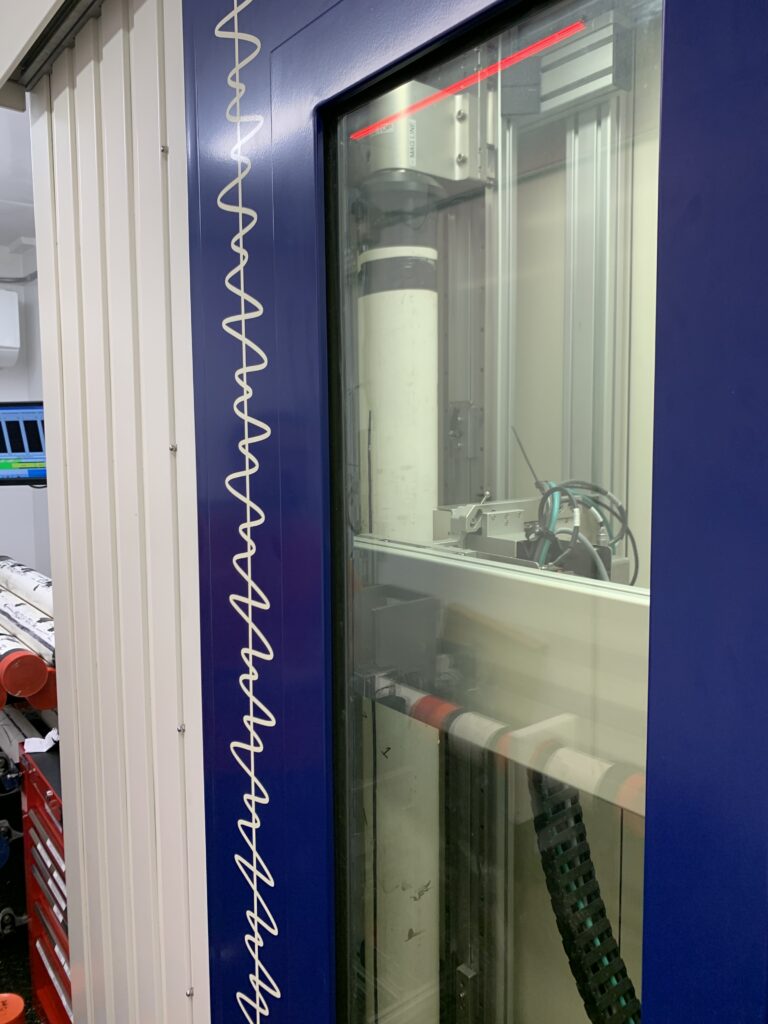
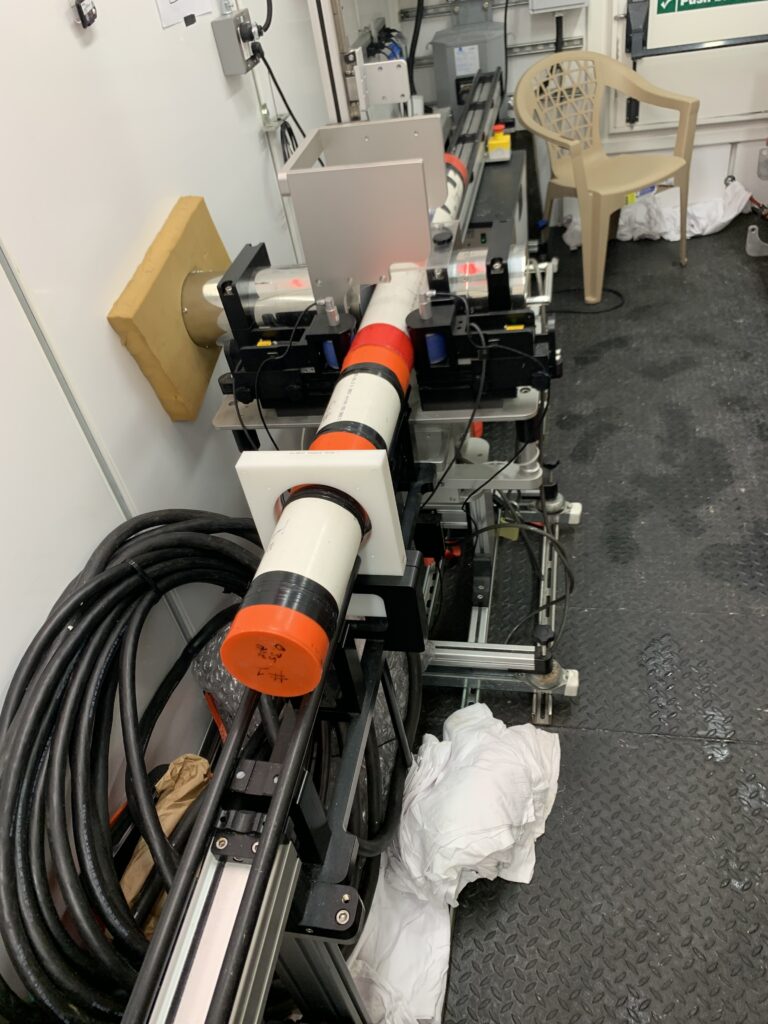
We finally have all of our core samples! The next step we are on is finishing up to various testing we will do on them. We have 3 different stations. Image one shows our water sampling. These tests will give us further insight into the original sources of any methane that might be in them (whether those sources are thermogenic or biogenic). It will also show us the chemistry of the water which could have an affect on ocean water chemistry and even the geophysical properties of the surrounding mud. Images 2 and 3 show the CT scanning and Multi-Sensor Core Logger (MSCL) process in our “van”. CT images allow us to look at what’s inside the cores without opening them up at sea, so we’re able to identify the type of sediment we collected and make more informed decisions about the other sampling we do (Image 2). The MST van also houses a MSCL (Image 3) which measures parameters in the core such as density and magnetic susceptibility. These data provide insight into changes that occur in the sediment which helps us to identify shifts in sedimentation over time. Lastly, our thermal conductivity is a physical parameter of the sediment (Image 4). Using our thermal conductivity as well as the temperature of the core sample itself can reveal the different temperatures of the sediment around and under the sample sites
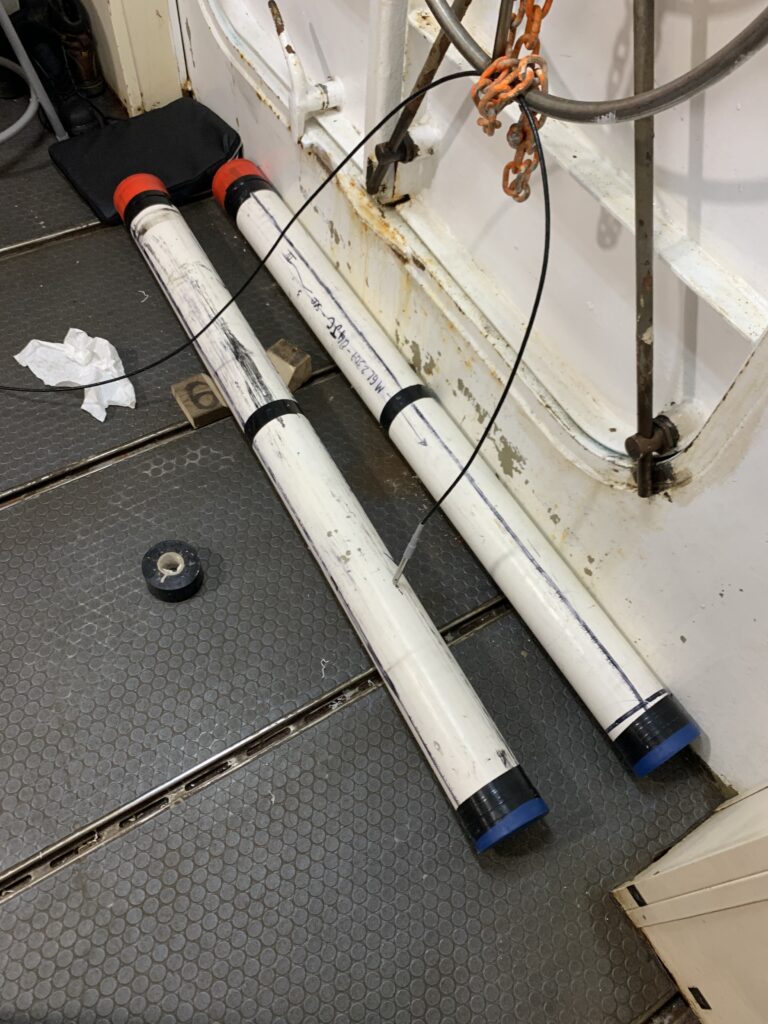
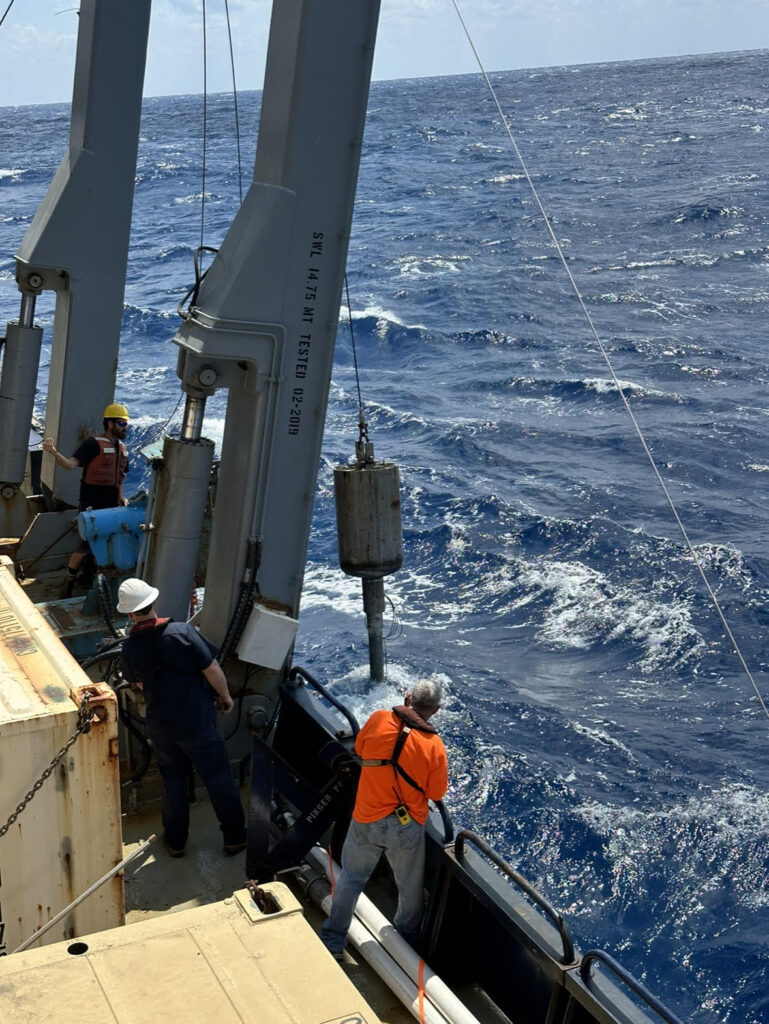
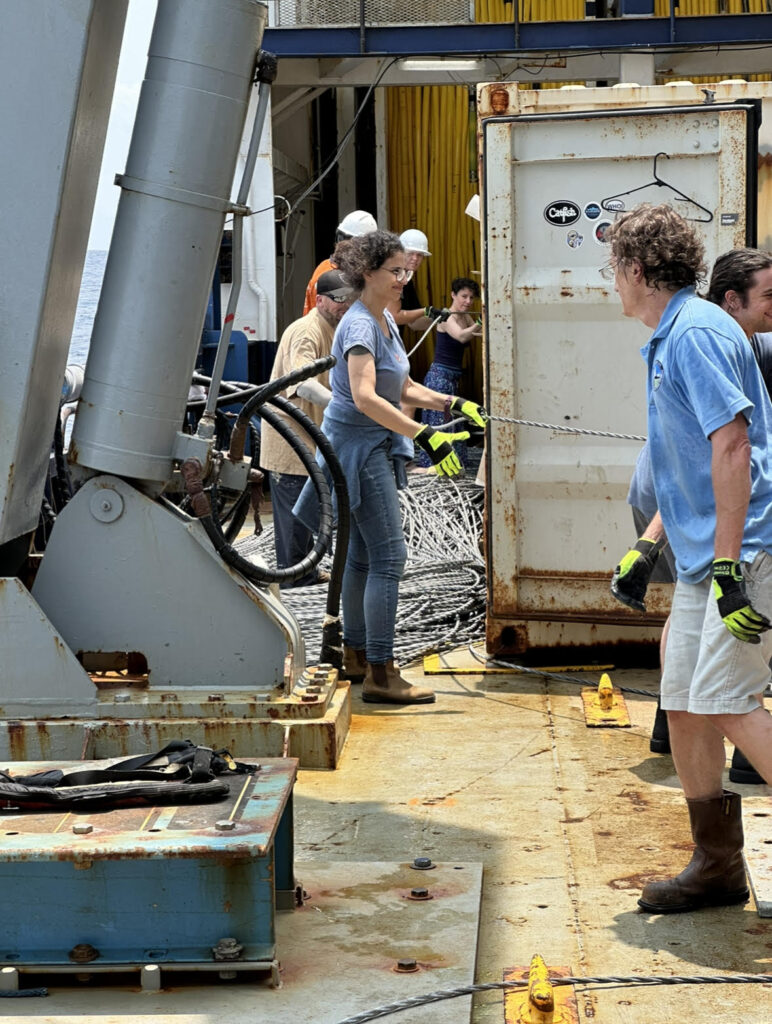
We’ve had a busy and exciting past few days as this coring leg gets us scientists out of the lab and into the field more often. We encountered rough seas the first day and a few technical and mechanical difficulties as we got our coring machines going, however, since Monday we’ve managed to acquire 4 gravity cores and 2 piston cores! We’ve also been getting water samples from these sites for alkalinity testing as well as running the cores through CT scans. Below are some pictures of the corer as well as a core sample which Ali and Hugh are discussing. We also have a picture of all the string we had to remove to get our machines running correctly. That process felt a lot like untangling a long line of headphone wires. Luckily the experienced coring crew had a solid method for getting it done efficiently.
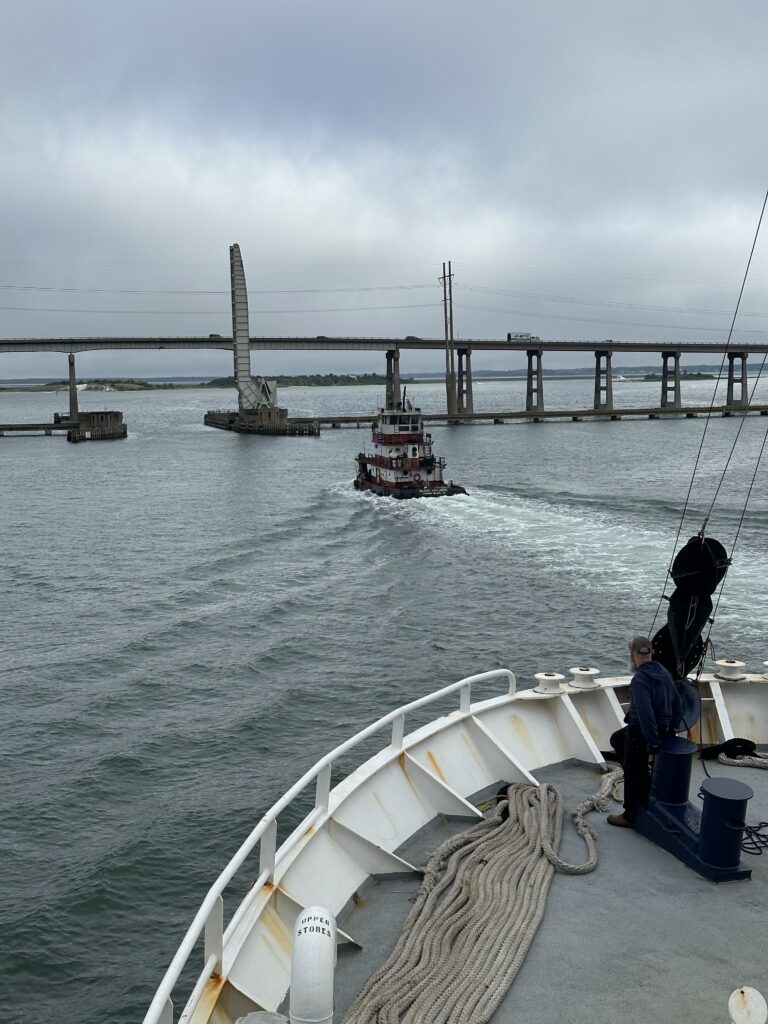
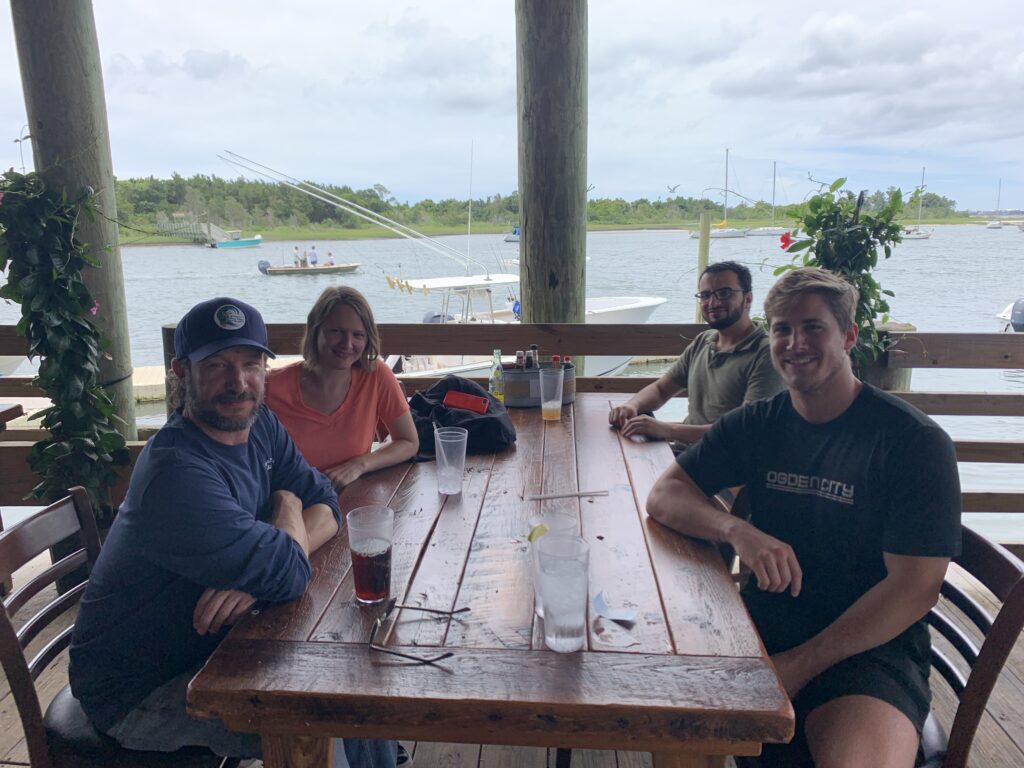
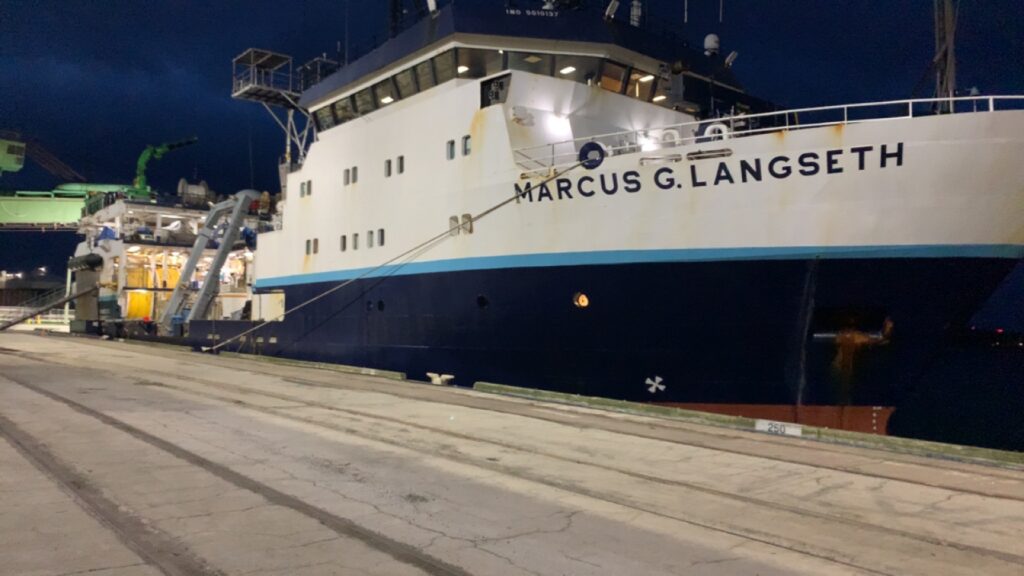
This morning we finally made port in Morehead City, NC where we are picking additional members for the science crew for our last leg of the trip. Today was a great day for getting some hard earned time on land and enjoying the sun. The pictures below show a few of us out on the town, the view on the way in, and an update on how our wonderful ship is looking!
Ali Mohamed, alongside Anne Bécel, has been working vigilantly to process our gravity and magnetic anomaly data. Here is a short summary of the findings provided by Ali:
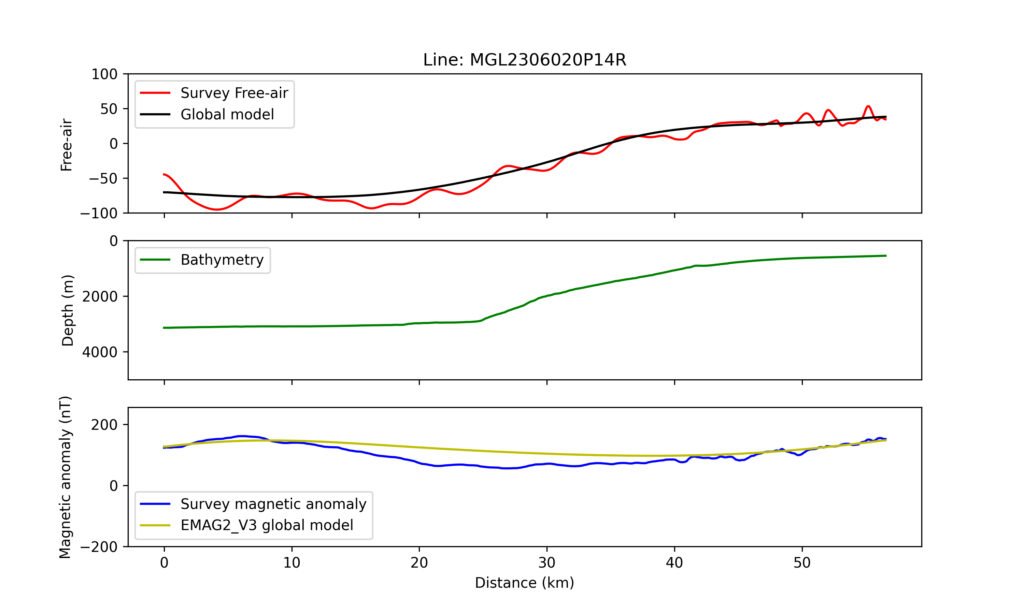
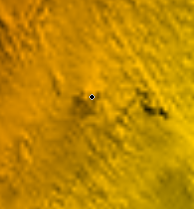
As we near the end of seismic acquisition, it’s time to show you some of our work. As you all know, during this fascinating first leg (1st phase of our cruise), we not only acquired Multichannel Seismic data (MCS) but also gravity, magnetic and bathymetry data as well as a bunch of other datasets such as temperature, salinity, sound velocity, and so on. Today, let’s explore the gravity and magnetic anomalies along one of our interesting lines. Shown in the figure are the gravity anomaly, magnetic anomaly, and depth to the seafloor along one of our profiles and compared with the global anomaly models of this area.
First of all, it’s known that the global models have a coarse spatial resolution. Having a look at our survey measurements, you may see that it’s not a big deal to acquire such data as it shows a similar overall trend of the global model and nicely more short-wavelength structures that we think might be real. However, these nice, smooth curves took a lot of time and effort to process. At a glance, due to the high spatio-temporal resolution of our instruments, the workflow to produce these nice curves include detecting and replacing missing data, detecting and replacing outliers, and applying Median and Gaussian filtering, when needed.
So, what do get from these plots? First, as you see on the gravity plot, there is a significant variation in the gravity acceleration between the measured and global model predictions. This also goes from negative to positive anomalies which implies a difference between bathymetry and lithology. As you see on the bathymetry plot, we are moving landward from deep water to the continental shelf. The magnetic data also shows high values when it crossed the famous East Coast Magnetic Anomaly (ECMA), a positive magnetic anomaly that parallels the coast. It’s not the case for this data only. Our target is to get as much processed data as we can, if not the full data, by the end of the cruise. That’s why our team works 24/7 in divided shifts and specified duties.
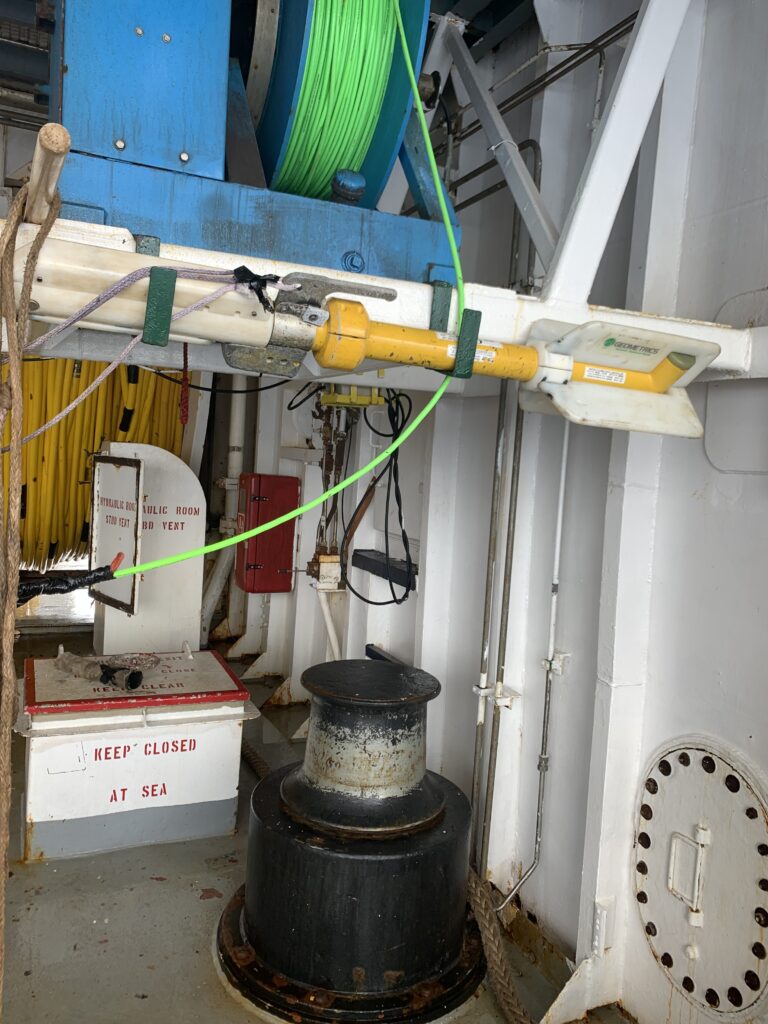
The first machine is our gravitometer and is used to gather our gravity data. The magnetometer (the second picture) is towed behind the boat to gather our magnetic anomaly data.
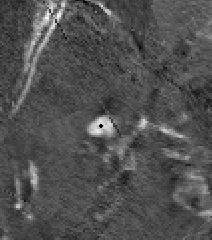
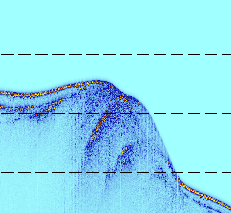
The second leg of our cruise will be focused on core retrieval. We’ll be using a piston coring system and expect to be able to recover cores up to 10 m long. After a few days of analyzing the large majority of different seismic and sonar data we have from our work so far, the team got together to discuss which areas contain good evidence for viable coring locations. When selecting these locations, we think back on one of the goals of this project which is to “study the role slope failures (underwater landslides) play in building a passive margin (area beyond the continental shelf)”. This is different than an active margin where plate tectonics plays a significant role. The images below all highlight different aspects of the same feature (~50 meter/~150 ft mound) almost 1000 meters under water. The first image shows our bathymetry (seafloor topography) data. The second image shows the backscatter (reflectivity of the seafloor) data. Using these two images, we can see a small mound-like feature that has high reflectivity (white). The third image is our seismic data at the same location. The area circled in black shows a reflection that doesn’t follow the stratigraphy (layer orientation) of the surrounding sediment. This could be evidence of fluid migration and a potential cause of slope failure. The last image shows sub-bottom profiler data in the same area where the yellow/orange areas have higher reflectivity. Collecting cores from areas such as this will allow for further testing, and eventually some answers to our hypotheses. Coring begins in less than a week, so we expect today’s discussion to continue until final sites are chosen.
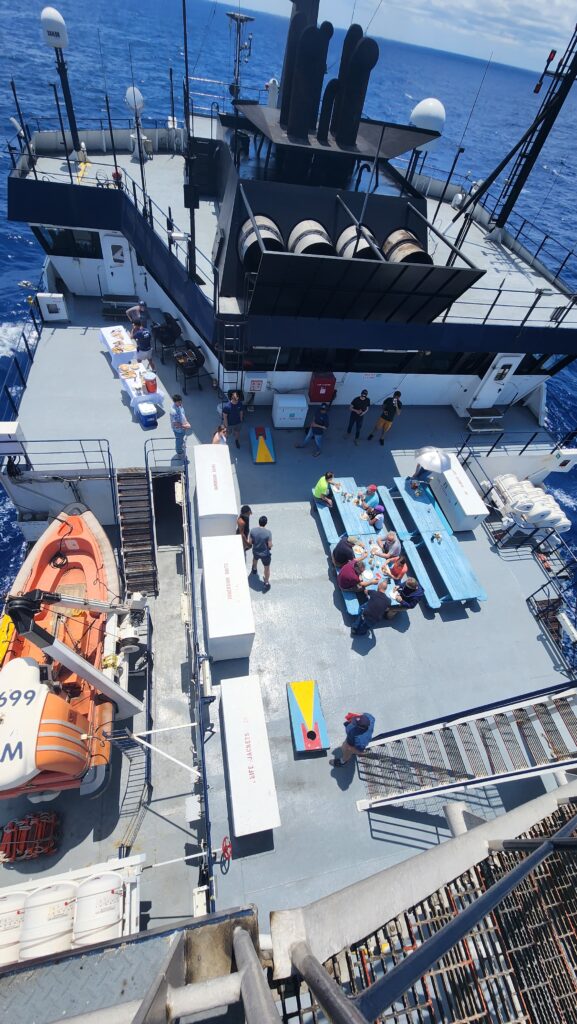
We were lucky enough to celebrate the holiday with clear skies and calm seas. Memorial Day meant a lunch composed of hamburgers and hotdogs along with some friendly cornhole competition. Let the record show that Ali and I (Mason) were the winners in a game against Hugh and James.
Today was a great way to have some fun times after a couple weeks of working hard together.
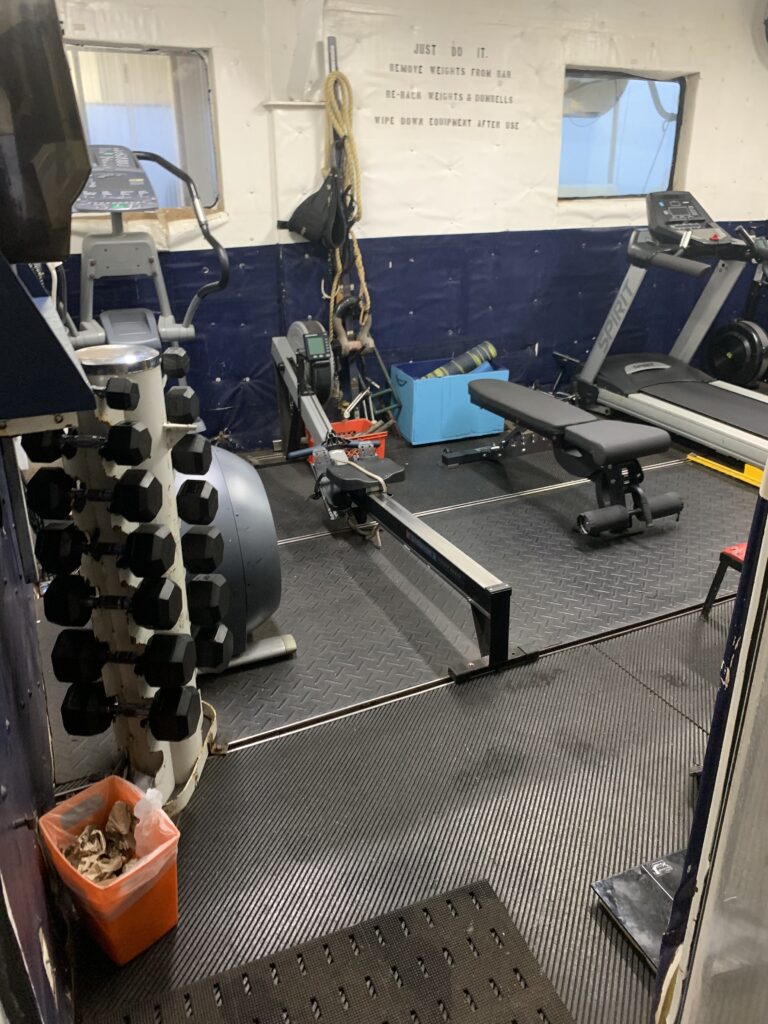
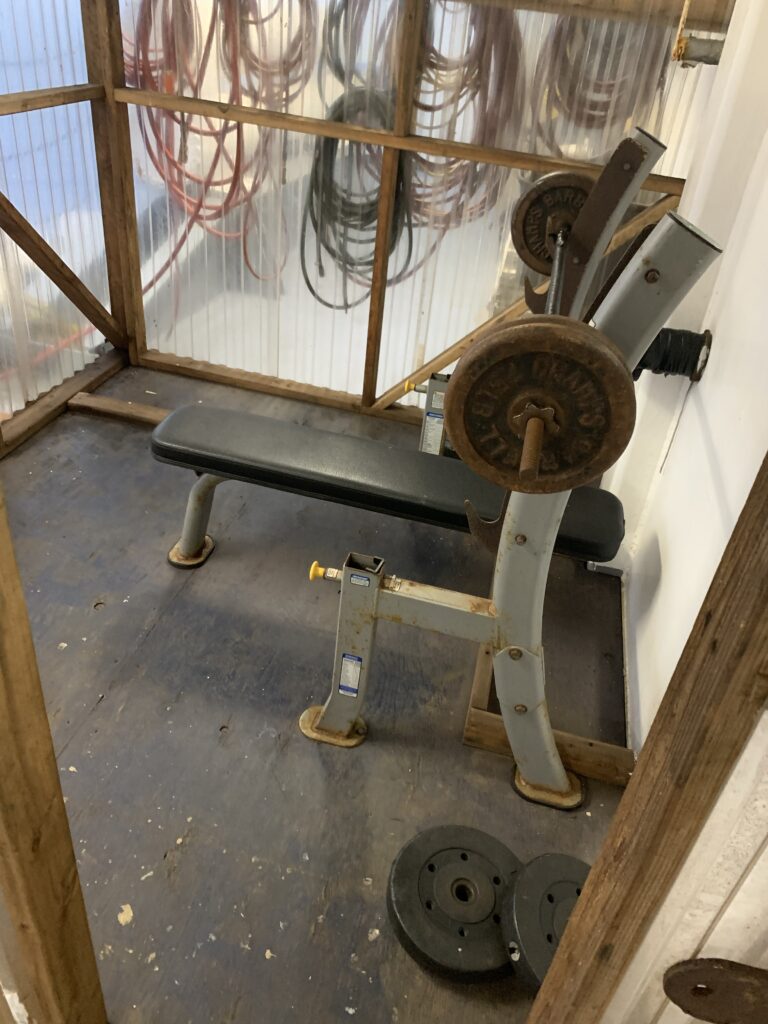
Before starting this research expedition, I had a few questions about what living on the ship would look like. One of the big questions was: “Is there even a gym? And if so, what’s it like?”. Sadly, the pictures I saw didn’t tell me much, so for future reference of those who care, I’d love to layout my thoughts and observations about the gym here on the R/V Langseth. First off, being creative is a must, but if you do a good job of it, the pulley system can give most of your muscles a good workout. They have a wide selection of bars you can attach to the pulleys and some you can stack free weight on. There is a pullup bar and dumbbells that go up to 40 pounds in increments of 5. There is even a bench outside! However, be sure to put on less weight than you normally would and take it slow. Nobody wants to end up cutting the cruise short because of a shoulder injury. For the cardio lovers there is a treadmill, bike, rowing machine and an elliptical. Plenty of the crew enjoy working out, but its not very often that more than 1-2 people are working out at the same time. Overall, the gym has plenty to utilize and I haven’t had many issues targeting the muscles I want.
The Mess Hall is where we eat every meal. I like to look out its windows (you can’t see the windows in the picture but they’re behind the fridge and off-screen to the right) and see what kind of waves we’re gonna have that day, despite being able to feel it on my walk over. While this area is always available to hang out in, it has a strict schedule for meal times. Breakfast, lunch and dinner are from 7:20-8:20AM, 11:30AM-12:30PM, and 5:00-6:00 PM respectively. Breakfast has a very similar selection each time, however, lunch and dinner change every day. Another effort the kitchen crew puts in for the rest of us is saving meals in the fridge. Because this is a 24/7 operation, some crew members have shifts that don’t allot time to show up for these meals, so we are sure to save a plate if someone asks. In case they wanted one of the hot meals, a microwave is available at any time.
Don’t worry, all parties in the picture were aware there was a picture being taken beforehand.
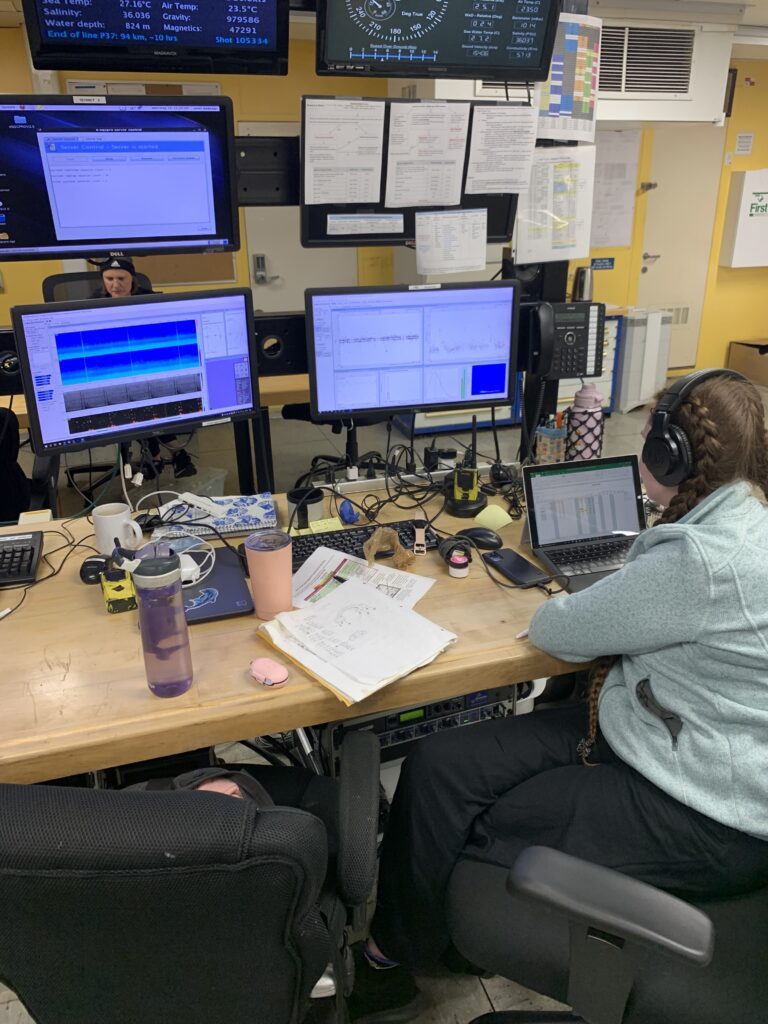
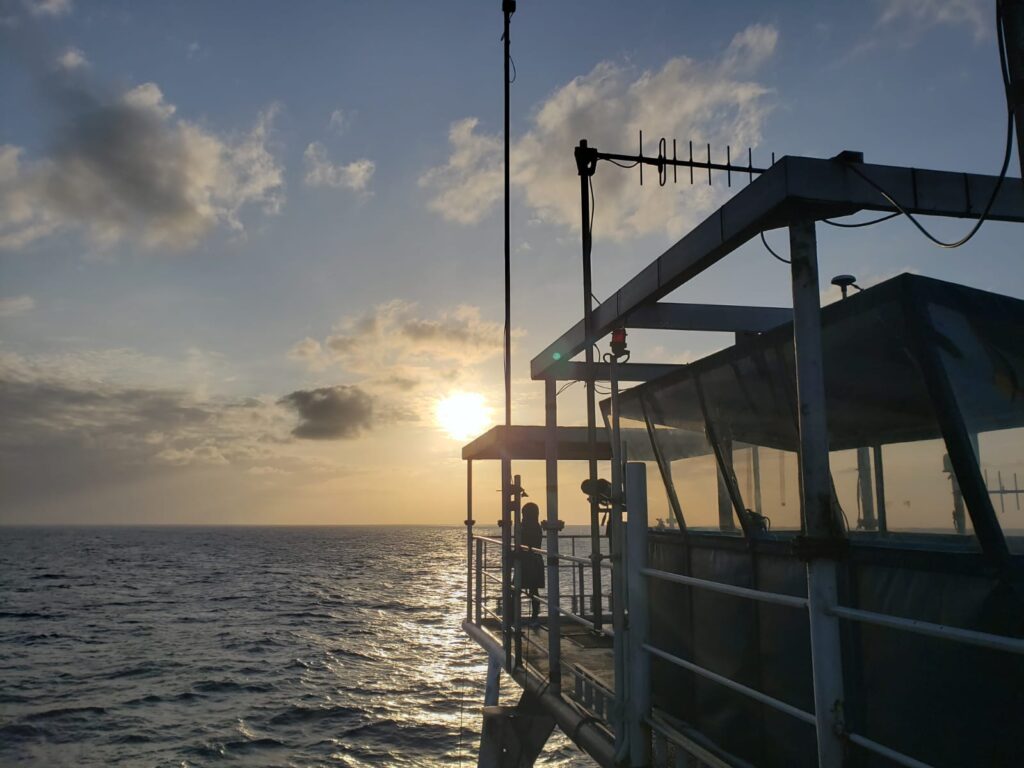
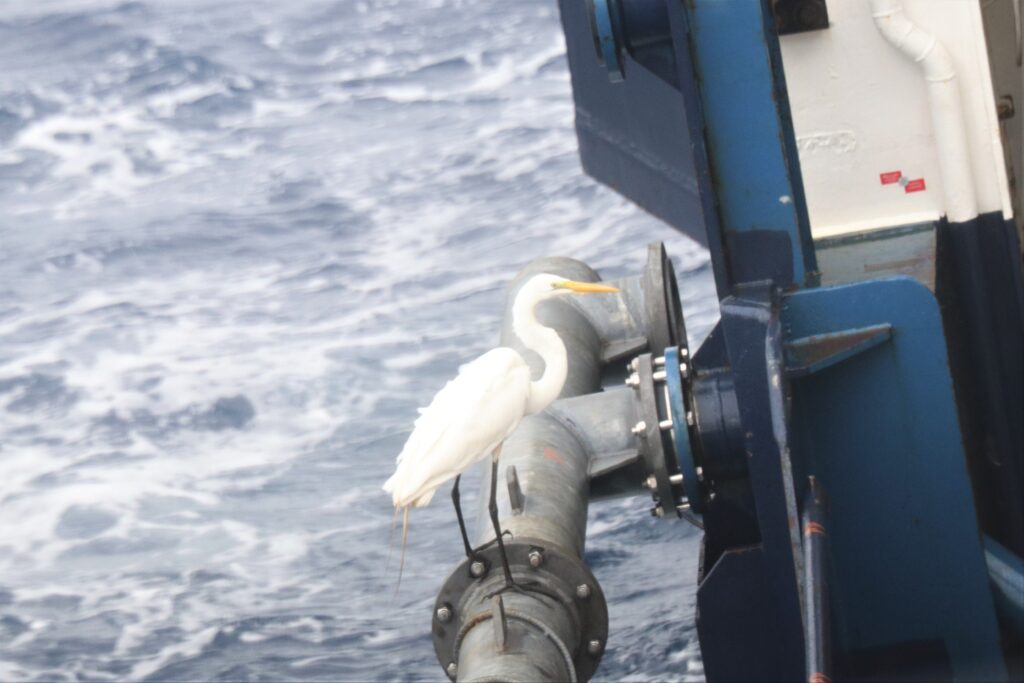
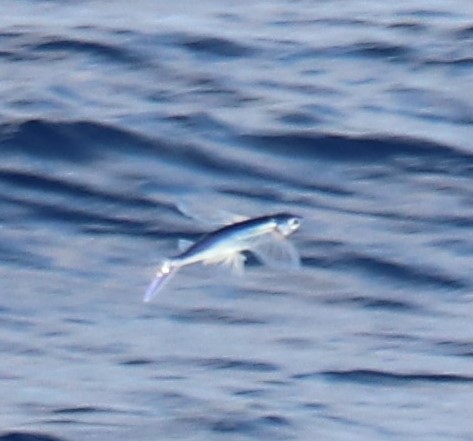
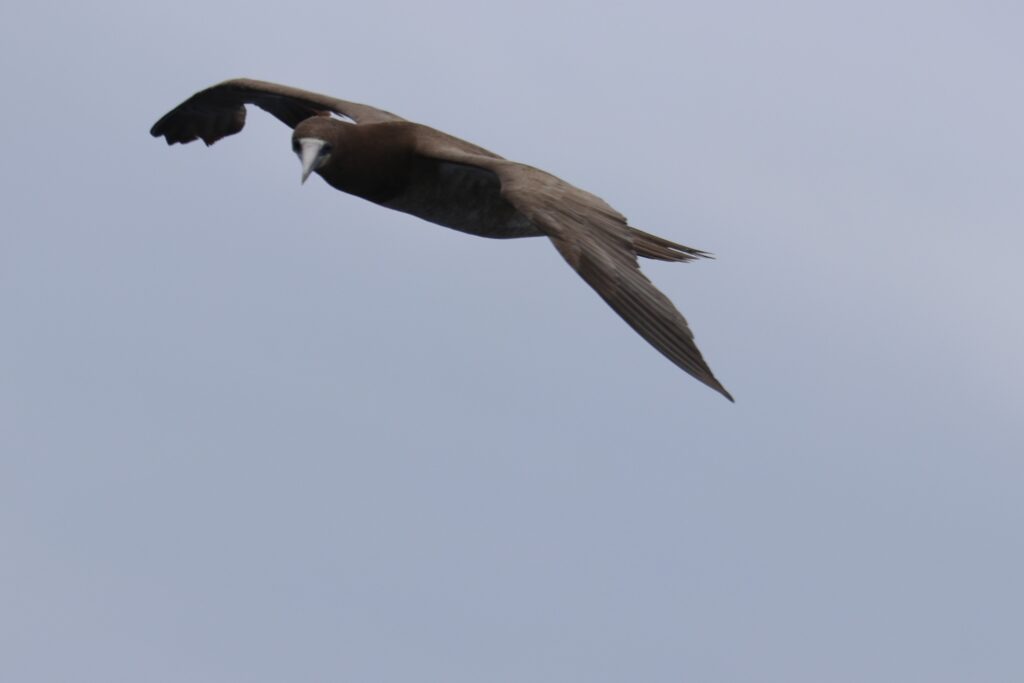
One of the best views of the ocean onboard the vessel is from the PSO (Protected Species Observer) tower, which stands about 19 meters above the water. The RPS PSO team consists of five onboard biologists that monitor, collect data and mitigate for dolphins, whales, sea turtles, and even a couple of protected birds, in order to minimize any potential impact of the survey onwildlife. On the tower, PSOs use handheld binoculars, Bigeye binoculars and DSLR cameras to document all animal sightings. From before sunrise to after sunset, there are always two PSOs watching for our oceans’ protected sea life. We are ready to pause survey operations when one of the aforementioned critters approach or are seen within certain ranges to the vessel equipment. In addition to keeping our “eyes” on the water, there is also always one of us listening for mammal vocalizations using a PAM (Passive Acoustic Monitoring) in the main lab 24/7 during the survey. The PAM system consists of a six-hydrophone towed cable and a processing system that visualizes the sounds in the water. The combination of watching and listening provides a highly effective combination of tools to detect the presence of ocean life. Our team of biologists love their jobs as stewards of all the amazing megafauna out here on the water and, speaking for myself, I can’t think of anything better than getting to go into the office on the ocean.