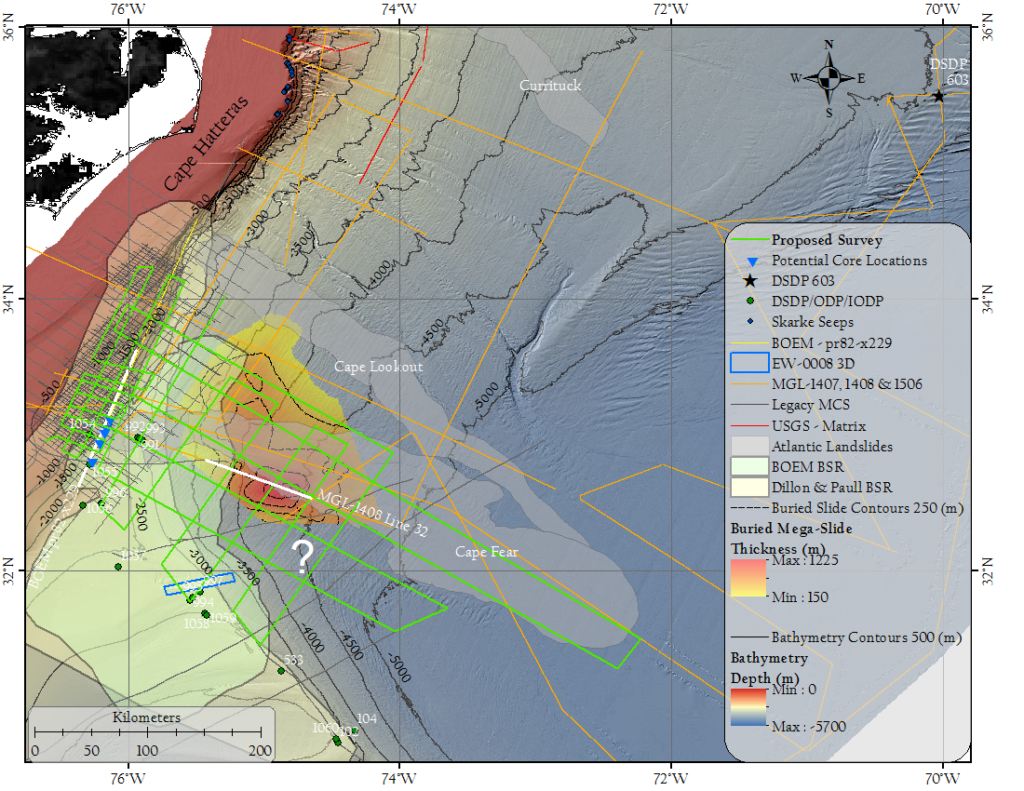
Regional map showing existing and proposed (green lines) seismic data. Bathymetry: Andrews et al. (2013); submarine landslides: Chaytor et al. (2009); seeps: Skarke et al. (2014). Recently revealed massive mass transport deposit is shown with interpreted thickness contoured. Blue triangles indicate potential core locations.
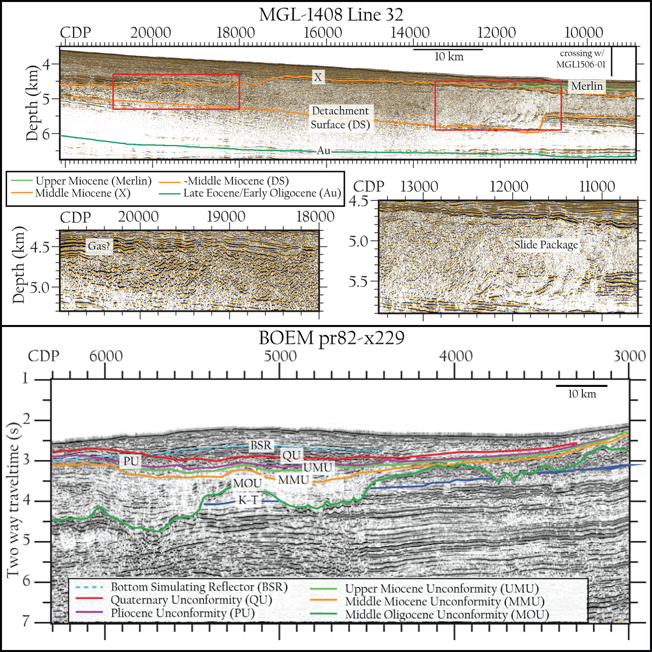
(a) Top panel: Example of a massive buried MTD on pre-stack depth migrated profile MGL1408-32 from the 2014-ENAM CSE. Interpreted horizons are shown. Lower left panel shows the top part of the slide. Above the top, a zone of
high amplitude is imaged and inferred to be a fluid-rich zone (indicated with gas label). Bottom right panel shows the thickest portion (~1.2 km thick) of the massive MTD (labeled “Slide Package”). (b) BOEM MCS strike profile PR82-x229 across the Cape Fear slide showing erosional relief on the Mid-Oligocene Unconformity (MOU) caused by MTDs (after Hill et al., 2018).