Following Johnson’s declaration, the government embarked on a major push to address various aspects of poverty and economic hardship. Medicare and Medicaid were launched in 1965, extending health coverage to millions of older Americans and poor families and alleviating a key source of hardship and insecurity for their families.
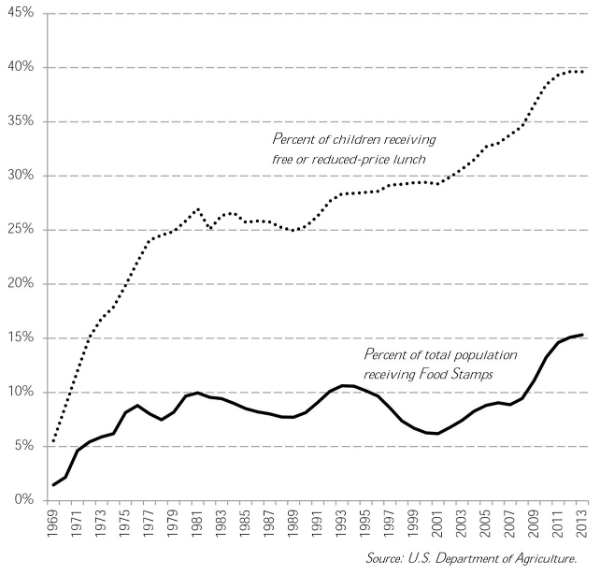
With the passage of the Food Stamp Act of 1964 and the Child Nutrition Act of 1966, food aid to the poor ramped up rapidly. The percentage of children getting free or reduced-price lunches at school jumped from six percent in 1969 to 27 percent by 1981. In the same year, the Food Stamp program reached ten percent of the total population by 1981 (see Figure 1). The school aid program that became known as Title I passed in 1965, giving federal money to schools and districts with high proportion of poor students.
In the 1960s, the government also established the Department of Housing and Urban Development, initiated an extensive federal loan program for college students, and increased Social Security payments. Johnson’s policies were continued under President Nixon. One of the most important programs, Aid to Families with Dependent Children (AFDC), provided cash assistance to a growing proportion of single mothers, until more than 35 percent were participating at the program’s peak in 1975.
Figure 1. Percent of U.S. population receiving free or reduced-price lunch, and Food Stamps: 1969-2013
The suite of social welfare programs introduced or expanded in that era moved millions of people out of poverty and improved the lives of millions more who remained income-poor. In that sense the war unquestionably was successful, demonstrating the continued ability of the government to direct the great wealth of the country to the improvement of public welfare.
Many of the improvements in American living standards are not reflected by the official poverty rate. That measure compares families’ money income to their consumption needs, disregarding any benefits they might receive (especially health care and tax credits) and also any costs that sap their resources (especially health care and child care). A poverty measure that factors in both these benefits and costs gives us a better sense of where the war on poverty has and has not worked.
The War on Poverty succeeded most dramatically for older people. Taking into account both changing costs and non-cash resources, the poverty rate for people age 65 and older fell from close to 50 percent in 1967 to 20 percent by the early 1980s. The improvement for children was more modest but still substantial.
In recent years, however, poverty has been rising once again, and the top and bottom of the income distribution are being pulled further and further apart. What happened?
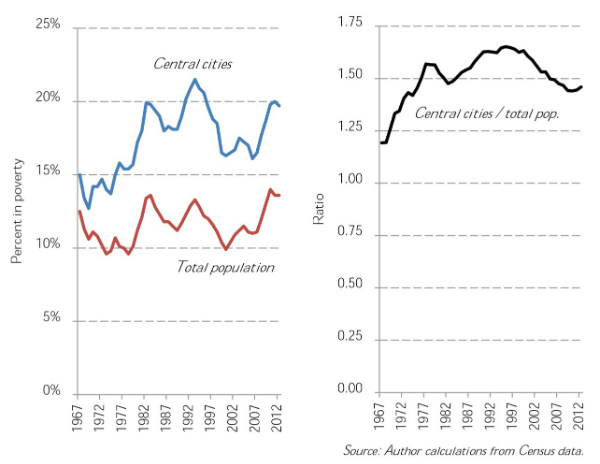
In the early 1980s, the country hit a turning point. That decade experienced several recessions and a steep decline in the manufacturing industry, accompanied by stagnating wages, weakening unions, and increasing poverty rates. As it became more expensive to counter these unfavorable trends, politicians abandoned their commitment to continue the struggle. President Reagan cut the budget for public housing and rent subsidies in half and slashed federal assistance to local governments by 60 percent. Just as U.S. cities faced their hardest times under the weight of industrial restructuring, the federal government withdrew much of its support. With budgets collapsing for schools, libraries, hospitals and other public services, local governments were unable to stop the decline of urban areas and the concentration of poverty there. The official poverty rate in central cities spiked up to 22 percent by 1993, more than 1.6-times the national average (see Figure 2).
Figure 2. Poverty in central cities versus total population: 1967-2012
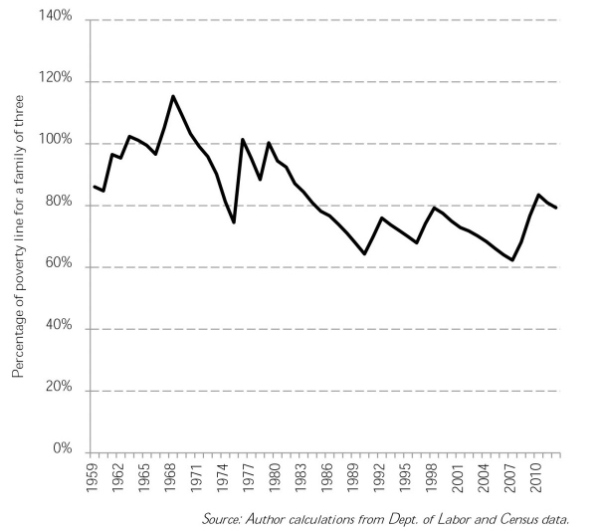
To make matters worse, the minimum wage wasn’t raised during the 1980s, even as inflation chipped away at its value. As a result, one worker in a minimum wage job could no longer keep a small family out of poverty (see Figure 3). In 1965, a person working 2,000 hours during the year earned just enough to reach the poverty line for a family of three. By the end of the 1980s, he or she could make only 68 percent of the poverty line.
Figure 3. Earnings for 2,000 hours at minimum wage, as percentage of the poverty line for a family of three: 1959-2012
There is no doubt that government programs still help tremendously, especially in the wake of the Great Recession. Some 49 percent of households receive support from one or more programs. In addition to the 16 percent on Food Stamps, 27 percent receive Medicaid, 16 percent receive Social Security, and 15 percent receive Medicare. And these programs do alleviate poverty. Without these programs, according to researchers at the Columbia Population Center, poverty rates would have risen by 5-6 percentage points between 2007 and 2012, meaning about 15 million more people in poverty.
Focusing on children, our most vulnerable citizens, highlights both the strengths and the limits of our current anti-poverty programs. By breaking out costs such as out-of-pocket medical bills and child care, and benefits such as government assistance and tax credits, as the Census Bureau now does, we can see what factors lift children above the poverty line and which pull them down below it. This “supplemental poverty measure” shows 18 percent of children living without enough resources to meet their basic needs – lower than the official rate of 22 percent, but still higher than in other countries with comparable wealth and resources.
Figure 4 shows how the most important elements beyond employment income affect that rate, by adding or draining resources that prevent poverty.
Figure 4. Effect of programs and expenses on percentage of children in poverty
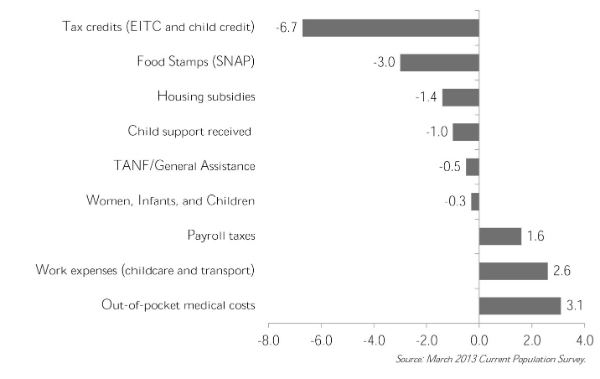
Tax credits for low-wage jobs and dependent children – which come as cash refunds to many poor families – reduce child poverty by 6.7 percent. Food Stamps bring the number down 3 percent. Those are effective government programs. On the other hand, the medical payments low-income families make, and the cost associated with employment for their parents (mostly childcare and transportation) each drive about three percent of children below the poverty line. Payroll taxes push 1.6 percent of children below poverty. The absences of policies to curtail health costs and provide affordable child care and public transportation exposes more of our children to poverty.
The high rates of child poverty in America highlight a basic feature about the U.S. system, and its principal vulnerability: ours remains predominantly a market-based system of care. As Janet Gornick as shown, U.S. inequality in earned income is not higher than that of most European countries, but the inequality that remains after taxes and government transfers is the highest – that is, we do less to redistribute resources to counter inequality in employment income. So getting and keeping a good job is what divides the haves from the have-nots in America. This may sounds like a reasonable principle – until we realize that many people cannot find livable wage jobs in today’s economy, while others have to leave such jobs in order to raise children or provide care-giving for other family members.
A key problem of our market-based system of care, as the economist Nancy Folbre has explained, is its failure to compensate care work and facilitate investment in the next generation. Most parents must either privately purchase child care – which can in some areas exceed the cost of college tuition – or stay home from work to care for the children. For breadwinner-homemaker families that share an adequate income from one earner, that may work (unless the couple divorces or the breadwinner becomes unemployed). And single parents with good incomes may be able to piece together a care regimen with paid child care. But for those with low-wage jobs, the market system falls short, and the resulting poverty undermines the upward mobility of their children.
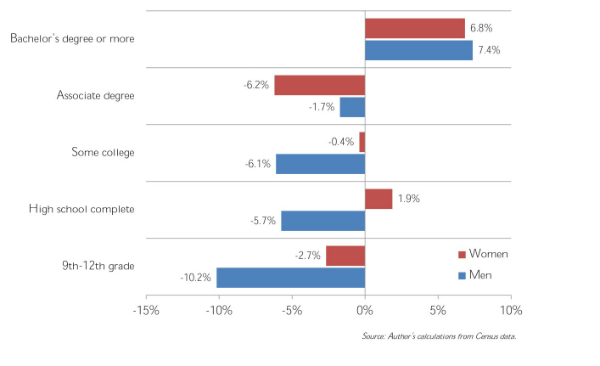
And the multiplication of low-wage jobs that has come with widening inequality is a formidable obstacle to reducing poverty today. That is the gap that our anti-poverty programs attempt to reduce, and the growing difficulty of that task has forced the programs to swim against the tide. A simple illustration of changing earnings for workers by education level underscores this point (Figure 5). Over the last two decades, earnings for those working full-time and year-round increased substantially only for those with bachelor’s degrees or more education – about seven percent. For everyone else, earnings have declined substantially or been flat. In a system where good jobs and personal income is the primary source of security and wellbeing, this widening inequality presents an increasing challenge.
Figure 5. Change in real median earnings for full-time, year-round workers, by gender and education: 1992-2012
The rise of single parenthood has been another tide against which anti-poverty programs have had to swim. Single-parent families have fewer adults to earn incomes, and the vast majority of those adults are women, whose earnings remain lower than men’s.
Yet single-parent families – principally single mothers – are not the main cause of child poverty today. Through the 1960s and 1970s, single-parent families represented a growing share of the poor. But since the mid-1980s, a fairly stable 34 to 39 percent of poor families have been headed by a single mother. Nevertheless, although single parenthood is not driving recent increases in child poverty, the poverty of single parents is especially acute. This illustrates the weakness of counting on the labor market to solve poverty in the absence of programs that subsidize parental caregiving so low-income parents of young children can stay home, and/or provide affordable, high quality childcare, so they can work without risk to their children.
In 1996, Congress replaced AFDC, the program Johnson expected to provide cash assistance to single mothers with children, with a program entitled Temporary Assistance to Needy Families, which combined new work requirements with a strong push to promote marriage among single mothers. As I show elsewhere, the attempt to promote marriage among poor parents and would-be parents has been an abject failure. The strong job market in the late 1990s and the expansion of the Earned Income Tax Credit did lead to increases in employment for poor single mothers, and child poverty improved. But since the employment boom of the late 1990s ended, there has been no further reduction in child poverty, and in the last decade the problem has grown worse, not better. Today, government policies force single parents to choose between marriage and employment as their means of supporting their children. For many parents, neither option provides adequate security, as discussed in Williams’ CCF briefing report.
There are much better options available to us. One promising approach is a guaranteed income program. It is often forgotten that President Richard Nixon actually proposed such a plan back in 1969, at a time when our political leaders seemed much more serious about waging war on poverty – and the House of Representatives passed a minimum income plan in 1970, though it died in the Senate.
A guaranteed income program could be accomplished through expanding the Child Tax Credit for those with children, or using the tax code to ensure a minimum income for everyone, presumably in combination with a program of government jobs. Alternatively, a variety of separate improvements might reduce either the level of poverty or its harms. These include raising the minimum wage, state-provided childcare, paid family leave, part-time wage protection, and of course health care.
All these possibilities should be on the table, because we know for sure, despite frequent claims to the contrary, that government can play a key role in reducing poverty. In 1999, Great Britain had an even higher child poverty rate than we do today. At that point the British embarked on their own war on poverty, as described by Jane Waldfogel. The government introduced new work requirements for welfare, but also established a minimum wage more generous than the U.S. one. As a result, more single parents got jobs, and the jobs they got paid better. At the same time, family leave for new mothers was extended to one year, with half of it paid. Legislators also put in place a system of income support for all but the richest parents, not conditional on employment, intended to increase investment in children’s wellbeing. Finally, the government introduced free preschool for all three- and four-year-olds, and made it easier to switch to part-time or flexible employment. Along with educational investment and school reform, the initiatives amounted to an increased investment in children of one percent of Britain’s gross domestic product. The result of such a concerted effort was a decline in child poverty of about one-quarter to one-half in a decade, depending on the measures used.
The British example highlights the limits of our own policies. Despite undeniable progress since the declaration of our own War on Poverty in 1964 – and even with the many lives improved through current programs – today’s anti-poverty efforts cannot be described as an “unconditional war on poverty.” At best, we have been fighting with one hand tied behind our back. We could do much more.
About CCF
The Council on Contemporary Families, based at the University of Miami, is a nonprofit, nonpartisan organization of family researchers and practitioners that seeks to further a national understanding of how America’s families are changing and what is known about the strengths and weaknesses of different family forms and various family interventions.
The Council helps keep journalists informed of notable work on family-related issues via the CCF Network. To join the CCF Network, or for further media assistance, please contact Stephanie Coontz, Director of Research and Public Education, at coontzs@msn.com, cell 360-556-9223.
