
By Rogelio Sáenz
University of Texas at San Antonio
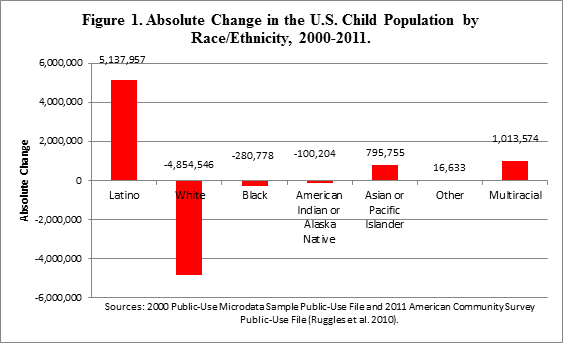
Latinos are increasingly driving the demographic fortunes of the United States. Between 2000 and 2011, the number of white children in the country declined by 4.9 million, a decrease of 11 percent. Blacks and American Indians and Alaska Natives also saw their child populations decline. The nation’s total child population, however, increased by 1.7 million in the same period, largely due to the growth in the Latino child population. The number of Latino children rose by 5.1 million during this period (Figure 1), an increase of 42 percent. The number of multiracial and Asian and Pacific Islander children also expanded, but much less than the increase of Latino youth.
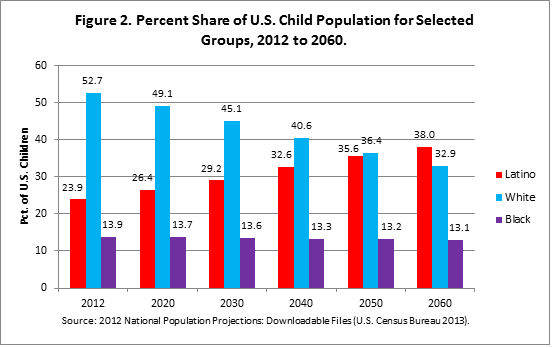
By 2060 it is projected that the proportion of white children will fall from 53 percent in 2012 to barely a third — just 33 percent (Figure 2). Latinos will have replaced whites as the nation’s largest child population, comprising almost 40 percent of the total. The black share of children is expected to decrease slightly from 14 percent to 13 percent during the period. The remaining 16 percent of children in 2060 will be largely Asian and multiracial youth.
Who are these Latino children? From Different Strands, But Deeply Rooted in the United States
Approximately 70 percent of Latino children, 12.1 million, are of Mexican origin (Table 1). Next in order are Puerto Ricans (1.6 million), Salvadorans (587,000), Dominicans (448,000), Cubans (394,000), Guatemalans (363,000), and Colombians (236,000).
| Table 1. Latino Children by Ethnic Group, 2011. | ||||
| Group | Number Children | Group | Number Children | |
| Mexican | 12,141,515 | Nicaraguan | 99,363 | |
| Puerto Rican | 1,603,171 | Venezuelan | 67,169 | |
| Salvadoran | 586,909 | Argentinean | 57,473 | |
| Dominican | 448,041 | Panamanian | 39,395 | |
| Cuban | 393,857 | Chilean | 35,115 | |
| Guatemalan | 363,994 | Costa Rican | 32,318 | |
| Colombian | 235,704 | Bolivian | 28,069 | |
| Honduran | 199,528 | Uruguayan | 17,972 | |
| Spaniard | 175,036 | Paraguayan | 6,008 | |
| Ecuadorian | 163,054 | Other | 562,733 | |
| Peruvian | 130,819 | |||
| Total | 17,386,243 | |||
Source: 2011 American Community Survey Public-Use File (Ruggles et al. 2010).
Despite the multitude of their countries of origin, more than 90 percent of Latino children were born in the United States or born abroad to U.S. citizens. Although the overwhelming majority are U.S. citizens, many Latino children have strong connections to the immigrant experience. Almost 54 percent of U.S.-born Latino children have at least one parent who was born outside of the United States. In addition, many Latino children live in mixed-status families and households, where some members are U.S.-born, others are naturalized U.S. citizens, and still others are undocumented immigrants. In this living arrangement some family members have access to resources—such as food stamps, healthcare, and so forth—while others do not.
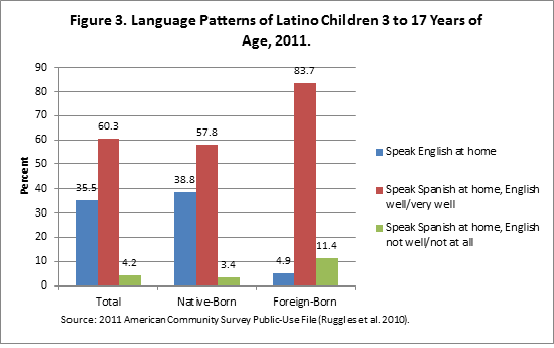
The language patterns of Latino children reflect their deep roots in the United States but also the strong ties of many to their ancestral roots. Latino youth three to 17 years of age tend to be bilingual, with three-fifths speaking Spanish at home and being fluent in English, and slightly more than one-third speaking English at home (Figure 3). Only a small fraction (four percent of all Latino children and less than 12 percent even of foreign-born ones) cannot converse adequately in English.
 _
_
Family and Household Arrangements of Latino Children
The majority of Latino children (54 percent) live in married-couple family households (Figure 4). Nearly a quarter live in family households headed by a single female and about one-sixth live either with a grandparent or with a single father.
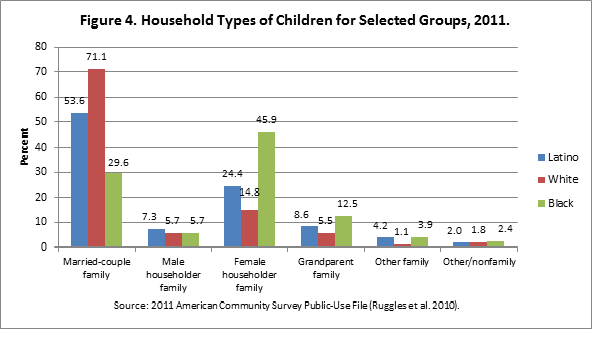
One of the household strategies that families utilize to deal with limited financial resources is doubling up in the homes of relatives and friends. One-tenth of Latino children live as part of subfamilies in the home of another family.
Educational Challenges
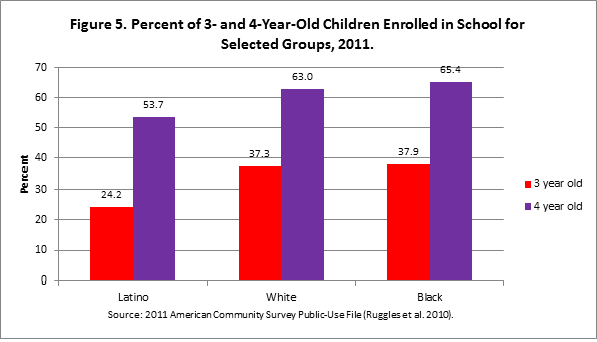
Latinos have consistently lagged behind other racial and ethnic groups in educational achievement, in part because of their low pre-school enrollment, which means they often enter kindergarten behind other students. Only about one-fourth of Latino three-year-olds and a little more than half of four-year-olds are enrolled in school (Figure 5). Their white and black counterparts are much more likely to be enrolled in school at these ages, with nearly two-fifths and close to two-thirds of three- and four-year-olds, respectively, attending school.
Although high school completion rates have been improving for Latinos in the past decade, nearly 15 percent of Latinos 16 to 24 years of age do not have a high school diploma or GED and are not currently enrolled in school. Not all of these are high school dropouts, because some of these individuals may have come to the United States to work and never did “drop in” to school. But both U.S.-born Latinos and blacks 16 to 24 are twice as likely as their white counterparts to be dropouts, and Latinos overall are still three times more likely than whites to lack a high school diploma.
Work and Latino Youth
Historically, youth from minority and poor families were much more likely than whites, especially middle-class whites, to hold jobs. Over the past half century, that pattern has been reversed. Among Latino and black youngsters 16 and 17 years of age, only one-sixth are in the labor force, compared to more than a quarter of white youth. And among white youth, those from more economically secure families are more likely to be employed or actively seeking employment than those from poor families. It appears that today the high labor force participation rate of white youth may be part of constructing an extracurricular profile, the lack of which may add to the disadvantages of poorer youth.
However, once in the labor force, youth of color have much higher rates of unemployment than whites. Here Latinos are in the middle, with 45 percent unemployment rates compared to 55 percent for blacks and 27 percent for whites (Figure 6). These figures partly reflect different levels of poverty in these different racial-ethnic groups. Poor white youngsters also have a high unemployment rate (46 percent). Nevertheless, youth of color who are poor have particularly high unemployment rates (blacks, 66 percent; Latinos, 56 percent).
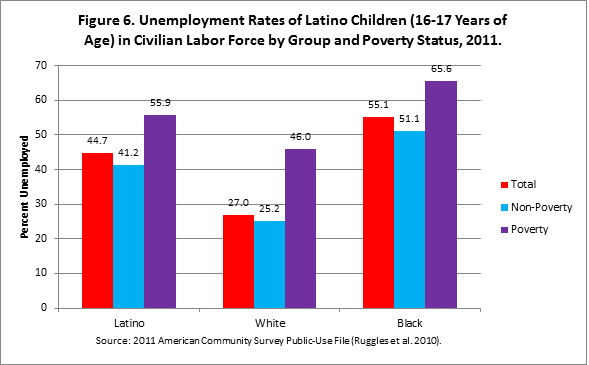
Thus, youth of color, especially the poor, are at a disadvantage in gaining employment experience, especially during the recent economic crisis. The lower labor participation rates of youth of color may reflect a higher prevalence of discouraged workers who exit the labor force after numerous attempts to secure employment.
Economic and Family Matters
More than one-third of Latino children are living in poverty, a rate that is slightly lower than the poverty rate of blacks and significantly higher than that of whites (Figure 7).
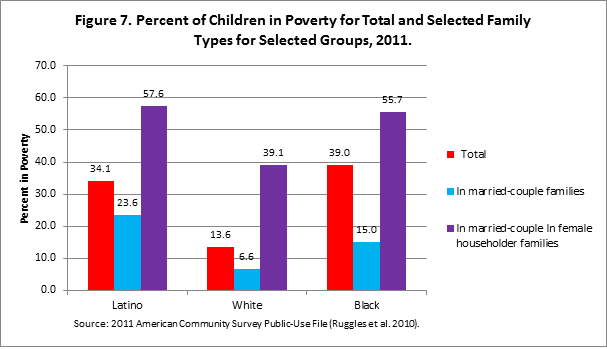
In general, children in female-headed family households are much more likely to be poor than children in married-couple households. Interestingly, however, the gap by household type is not as great among Latinos as among whites or blacks. Nearly a quarter of Latino children in married-couple families are poor, which suggests that marriage is not the solution to poverty issues in Latino communities. Latino families do not appear to receive the same degree of premium for having both parents at home that black and, especially, white families receive.
The Mortality Paradox of Latino Children
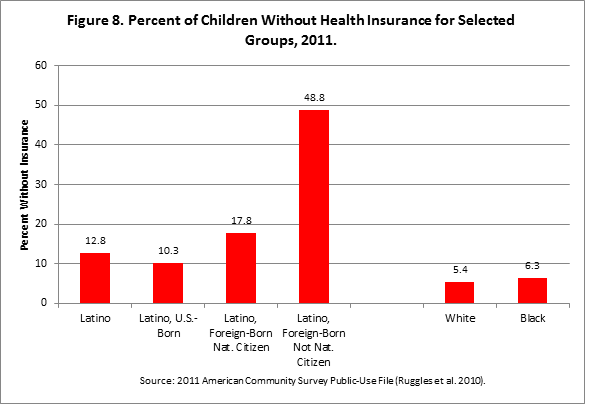
Latino children have many characteristics that are typically associated with problematic health and mortality outcomes. They tend to have low levels of educational attainment and high levels of poverty. In addition, Latino children are less than half as likely as white and black children to have health insurance. Approximately one in eight Latino youngsters lacks insurance (Figure 8). These indicators should predict significant health problems and relatively high levels of mortality among Latino children.
In fact, however, Latino children are quite healthy. Regardless of age, Latino children are less likely to die than white children and considerably less likely to die than black children (Table 2). Black infants, for example, are 2.3 times more likely than Latino children to die before reaching their first birthday. White youth between the ages of five and nine are 30 percent more likely to die than their Latino counterparts. Among both boys and girls, the life expectancy at birth of Latinos is higher than for their black or white counterparts.
| Table 2. Death Rates by Age for Selected Groups, 2010. | |||
| [Deaths Per 100,000 Persons] | |||
| Age Group | Latino | White | Black |
| Under 1 | 510.7 | 529.3 | 1,170.4 |
| 1 to 4 | 22.7 | 24.7 | 40.2 |
| 5 to 9 | 8.8 | 11.4 | 15.9 |
| 10 to 14 | 11.7 | 13.8 | 20.2 |
| 15 to 19 | 41.5 | 47.5 | 70.6 |
Source: Source: National Center for Health Statistics (Murphy et al. 2013).
Latino baby boys born in 2010 are estimated to live, on average, 2.1 more years than white baby boys and 7.1 more years than black baby boys (Figure 9). Latina baby girls born in 2010 are expected to live an average of 2.7 more years than white baby girls and 6.1 more years than black baby girls.

These favorable mortality patterns of Latino children exemplify the epidemiological paradox (also referred to as the Latino paradox) that was first observed approximately three decades ago. Despite having higher levels of poverty and lower access to health insurance, Latino infants and children tend to die at relatively low levels even compared to more advantaged white children.
The epidemiological paradox involving infant mortality is due primarily to foreign-born Latinas who, in particular, tend to give birth to healthy babies. Why do foreign-Latinas, despite their low socioeconomic status, have healthy babies? Several hypotheses have been proposed to explain this epidemiological paradox. For example, Alberto Palloni and Jeffrey Morenoff (2001) suggest that women who migrate to the United States tend to be healthy and therefore have healthy babies. In addition, Dolores Acevedo-Garcia and her colleagues (2007) argue that Latina immigrant women hold on to more traditional and healthy cultural practices—e.g., high levels of family support, low levels of smoking and drinking, and so forth—leading to healthier babies. Alternatively, Palloni and Morenoff (2001) suggest that the paradox may be a statistical artifact: If immigrant women give birth along the border and return to Mexico after the baby is born, any deaths of such infants are recorded in Mexico, resulting in an undercounting of the actual death rate in the United States. While the verdict is still out on the explanation of the epidemiological paradox, I suspect that while all these hypotheses carry some weight, cultural practices associated with low levels of smoking and drinking are especially important in producing healthy babies. Yet the health advantage of immigrants, including Latinos, diminishes with increasing time in the United States, as they adopt American lifestyles and diets.
Conclusion
By 2020, nonwhite children as a whole will outnumber white children, with Latinos replacing whites as the nation’s single largest child population sometime between 2050 and 2060. It is already clear that Latinos are become an increasingly larger share of American students, workers, consumers, and voters. For this reason, it is crucial that policymakers develop policies and programmatic initiatives to ensure that Latino children succeed educationally and reach their full potential. While this report points to a need to improve access to education, health insurance, and jobs for Latinos, it also suggests that Latinos may offer a model for other Americans in protecting children from premature death. It is essential that Latino children be viewed as an asset rather than a liability, as children who are our children and our future. An investment in the future of these children—upwards of 90 percent born in the United States—will yield major returns in the form of an educated and competitive workforce and engaged citizenry.
For Further Information
For further information, contact Rogelio Sáenz, Dean for the College of Public Policy, University of Texas-San Antonio; Rogelio.Saenz@utsa.edu.
References
Acevedo-Garcia, Mah-J. Soobader, and Lisa F. Berkman. 2007. “Low Birthweight among U.S. Hispanic/Latino Subgroups: The Effect of Maternal Foreign-Born Status and Education.” Social Science & Medicine 65:2503-2516.
Antecol, Heather and Kelly Bedard. 2006. “Unhealthy Assimilation: Why Do Immigrants Converge to American Health Status Levels?” Demography 43 (2):337-360.
King, Miriam, Steven Ruggles, J. Trent Alexander, Sarah Flood, Katie Genadek, Matthew B. Schroeder, Brandon Trampe, and Rebecca Vick. 2010. Integrated Public Use Microdata Series, Current Population Survey: Version 3.0. [Machine-readable database]. Minneapolis: University of Minnesota. Accessed online on 16 December 2013 at https://cps.ipums.org/cps/.
Murphy, Sherry L., Jiaquan Xu, and Kenneth D. Kochanek. 2013. Deaths: Final Data for 2010. National Vital Statistics Reports 61 (4). Hyattsville, MD: National Center for Health Statistics. Accessed online on 19 December 2013 at http://www.cdc.gov/nchs/data/nvsr/nvsr61/nvsr61_04.pdf.
Palloni, Alberto and Jeffrey Morenoff. 2001. “Interpreting the Paradoxical in the Hispanic Paradox: Demographic and Epidemiological Approaches.” Annals of the New York Academy of Sciences 954 (1):140-174.
Ruggles, Steven, J. Trent Alexander, Katie Genadek, Ronald Goeken, Matthew B. Schroeder, and Matthew Sobek. 2010. Integrated Public Use Microdata Series: Version 5.0 [Machine-readable database]. Minneapolis: University of Minnesota. Accessed online on 16 December 2013 at https://usa.ipums.org/usa/index.shtml.
U.S. Census Bureau. 2013. 2012 National Population Projections: Downloadable Files. Washington, DC: U.S. Census Bureau. Accessed online on 21 December 2013 at http://www.census.gov/population/projections/data/national/2012/downloadablefiles.html.
