A briefing paper prepared for the Council on Contemporary Families by Amanda Jean Stevenson, Department of Sociology and Institute of Behavioral Science, University of Colorado Boulder, together with Shelley Clark, Department of Sociology, McGill University, Jennifer Beam Dowd, Department of Population Health and Leverhulme Centre for Demographic Science, University of Oxford, Alison Gemmill, Department of Population, Family and Reproductive Health and Hopkins Population Center, Johns Hopkins University, Karen Benjamin Guzzo, Department of Sociology and Carolina Population Center, University of North Carolina at Chapel Hill, Sarah R. Hayford, Department of Sociology and Institute for Population Research, Ohio State University, Laura D. Lindberg, School of Public Health, Rutgers University, and Leslie Root, Institute of Behavioral Science, University of Colorado Boulder.
August 20th, 2025
Population panic – worries about “depopulation” linked to low birth rates – has become pervasive, with dire predictions in both the short and long term. Yet demographers like us – experts who explicitly study population size, composition, and structure – are generally not highly concerned. Why is this? It’s because we understand the strengths and limitations of population projections. Projections can accurately describe how populations will change if we know future birth, death, and migration rates. But demographers are well aware that they don’t have a crystal ball – we can’t fully anticipate economic shifts, political changes, global events, or how future generations will respond to their changing worlds. That’s why the farther we project from the present, the less accurate those projections are likely to be.
What are Population Projections?
In demography, our most common population projection tool is called cohort component projection. This tool treats different age groups (cohorts) separately, applying rates representing the three components of population change – birth, death, and migration – to each one. A cohort component projection begins with a baseline population (usually based on high quality censuses and surveys) and our most recent birth, death, and migration rates. Then, we make our best guesses about birth, death, and migration rates for every year in the projection. At least initially, our best guess is that future rates will be similar to current rates. We apply our estimate of next year’s rates to the baseline population, generating a projected population for the next year. Then we take this projected population and repeat the process, applying likely future rates for each year in turn until we reach the final projected year. To project a population fifty years into the future, we do this process fifty times, with each year’s projections feeding into the next.
Therefore, population projections require that we use expected birth, death, and migration rates for each year between the baseline data and the end of the projection. For example, if we want to project the US population in 2030 based on 2024 data, we must come up with likely birth, death, and migration rates for 2025, 2026, 2027, 2028, and 2029. And because it is a cohort-based model, it uses a separate birth, death, or migration rate for each 5- or 10-year age group. This can easily mean juggling dozens of rates just to project forward one year.
The best way to get those dozens of rates for each year is to rely on current rates and recent trends. This works well when things are changing slowly and in predictable ways, but it means our projections are often limited to forecasting a future that’s a lot like the present.
How Good are Demographic Projections at Predicting the Future?
Historically, demographic forecasts have often not anticipated major changes in birth, death, and migration. For example, much like today, in the 1930s and 1940s many commentators bemoaned the low fertility of the time. Expert projections of US population from the 1930s assumed that fertility would remain relatively constant into the future. They imagined fertility rates would continue as they were indefinitely, yielding rapid population aging and slow population growth. Yet fertility did not remain low – instead we got the Baby Boom. As a result, population projections from the 1930s and 1940s predicted actual future population size quite poorly.
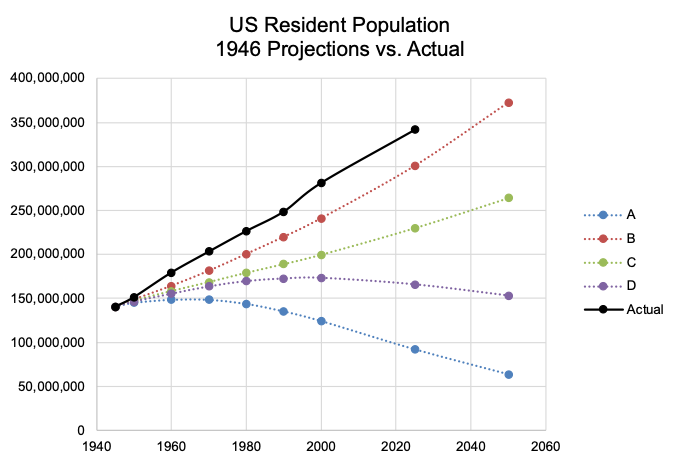
To illustrate this point, the figure[1] to the right compares Social Security Administration population projections from 1946 (dotted lines) with the actual US population (solid black line). Four different projections were prepared in 1946, each making assumptions of birth, death, and migration rates at various levels. It is clear that even the most “optimistic” 1946 projection, represented by “B” line, underestimated the actual US population by 1950. Moreover, the magnitude of underestimation increased over time. This illustrates how differences between what we think birth, death, and migration rates might be – our assumptions about the future – and the actual course of events compound over time. Any differences between expected rates and actual future rates can yield increasingly large differences between population projections and the eventual reality.
Human history demonstrates that the past is the best predictor of tomorrow…right up until it isn’t. At their best, population projections are well-informed extrapolations of current information. Things change – and the likelihood of change increases as periods of projection get longer. The discussions around low birth rates that warn of rapid aging, fiscal shortfalls, empty kindergartens, and ultimately population collapse all assume that current trends will continue indefinitely. We should all be skeptical of that.
Acknowledgment
This work benefited from research, administrative, and computing support provided by the University of Colorado Population Center, funded by the Eunice Kennedy Shriver National Institute of Child Health and Human Development (NICHD) (Project 2P2CHD066613-06); the Carolina Population Center, funded by NICHD (Project 5P2CHD050924-20); The Ohio State University’s Institute for Population Research, funded by NICHD (Project 5P2CHD058484-15); and the Hopkins Population Center, funded by NICHD (Project P2CHD042854-20). The authors would like to thank the staff at CCF for their assistance with the production of this article and the CCF editorial board for their helpful comments in drafting this brief.
For More Information, Please Contact:
Amanda Jean Stevenson
Associate Professor, Department of Sociology
Director of Population Program, Institute of Behavioral Science
University of Colorado Boulder
Amanda.Stevenson@Colorado.edu
[1] Projections: Myers, Robert J. Projections from Illustrative U.S. Population Projection, 1946. January 1948. Office of the Actuary, Social Security Administration. https://www.ssa.gov/oact/NOTES/pdf_studies/study024.pdf
Decennial populations 1950-2010: https://www.census.gov/data/tables/time-series/dec/popchange-data-text.html
Estimated actual population for June 5, 2025: https://www.census.gov/popclock/