| In 2017 LLILAS Benson Latin American Studies and Collections created these teaching resources as part of a traveling version of the exhibition titled: Mapping Mexican History: Territories in Dispute, Identities in Question. The project was funded through a US Department of Education Title VI public engagement and outreach programming grant. A digital version of the exhibition is available here.
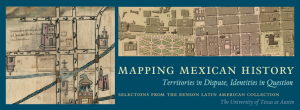
The digital materials available here are in the public domain and free for use in courses and research. Please cite the materials as coming from the Benson Latin American Collection, The University of Texas at Austin. About the Exhibition: The Mapping Mexican History: Territories in Dispute, Identities in Question exhibition composed of selections from the Nettie Lee Benson Latin American Special Collection first opened at the University of Texas at Austin in 2013. It focused on three distinct moments when maps played an integral role in the transformation of Mexico and its political geography. In the sixteenth century, early colonial pictographic maps drawn by indigenous artists reflect the growth of Spanish colonial administration. These maps show how indigenous elites adapted pre-Hispanic visual traditions to Europeanized forms of documentation to record their histories and defend claims to land and power. In the eighteenth century, new maps of Mexico’s principal cities serve as both representations and instruments of the viceregal government’s efforts to re-order and regulate Mexican social life and public spaces. And in the nineteenth century, maps are central to the military struggle for independence and the defense of contested national borders. About the Traveling Exhibit Project: In 2017, LLILAS Benson arranged for multiple original-size high resolution facsimiles, text and identification labels of the exhibition Mapping Mexican History: Territories in Dispute, Identities in Question. These traveling exhibitions in a box were displayed at a variety of institutions including South Texas College Library, University of Texas Rio Grande Valley Brownsville Library, and the Consulate General of Mexico in Austin. Alongside the display of the collection facsimiles, LLILAS Benson staff and project coordinators hosted multiple free workshops on using digital tools for research. |
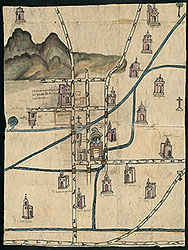 |
Culhuacan, 1580 January 17
Map of Culhuacán, or “a curved hill point” in Nahuatl, an indigenous community in the outskirts of Tenochtitlan (present-day Mexico City). This map, along with a written account, was a response to King Philip II’s request for information on their community. Visual Analysis | Lesson Plan (Grades 1-5) | Original Image | Map Coloring Pages |
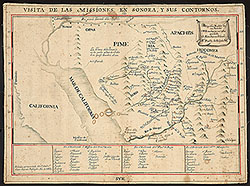 |
Sonoran Missions, dated either 1725 or 1751
Map focuses on the region of Sonora with tables showing Los Partidos of San Francisco Xavier, San Francisco de Borja, and Santos Martyres. The map depicts primarily the North American Sonoran desert and the various missions established during the 17th and 18th century. |
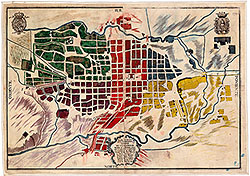 |
Valladolid, 1794
Map of Valladolid in Michoacan, now known as Morelia. Before 1545, the city was called Guayangareo and Ciudad de Mechuacán. Visual Analysis | Lesson Plan (Grades 9-12) | Original Image |
Materials for digital scholarship activities:
| Mexico’s Cities: Then and Now Using digitized historical maps held at UTEP’s Special Collections and the University of Texas at Austin’s Benson Latin American Collection, participants will learn how to use MapWarper, a geo-rectification tool for map images, to analyze the spatial evolution of Mexican cities.Full-Size Map Images | Maps in MapWarper |
| Tracing the Migration of Friars in 16th-Century New Spain Using biographic data from an Augustinian book of professions (1537-1620) preserved at the Benson, we will explore the familial origins of friars in 16th-century Mexico with ArcGIS, a web application that can be used in the visualization and analysis of geospatial information.For the workshop, please download the corresponding PDF in Scanned Pages. We will provide you a number so you may select a specific one to work on during the workshop. The Collaborative Spreadsheet will be used during the second part of the workshop.Scanned Pages | Collaborative SpreadsheetFor after the workshop we have created a complete step-by-step and a cleaned dataset to practice on your own:Guide | Complete Dataset |
| Reinterpreting “Mapping Mexican History” Attendees will reinterpret the exhibition’s maps digitally using StoryMapJS, a straightforward web-based authoring platform for the presentation of map and visual material analyses. For the first part of the workshop we will be utilizing the Map Tiles distributed.If you would like to create your own Gigapixel image, here is a guide.If you would like to work on other Map Tiles in the LLILAS Benson Collections, the link and a guide are provided below.Map Tiles | Guide (using exhibit maps) |
Credits:
| Itza A. Carbajal, 16′-17′ ARL/SAA Mosaic Fellow
Joshua G. Ortiz Baco, Digital Scholarship Graduate Research Assistant Marlena Cravens, Storymap Curator Albert A. Palacios, LLILAS Benson Digital Scholarship Coordinator |