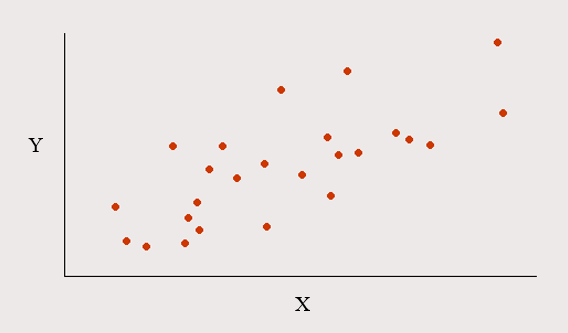
So you have two numeric variables you want to analyze. Question: What type of relationship do these variables have?
As one variable increases, the other variable either increases or decreases at a roughly constant rate.
Example:
For more information: Creating a Scatterplot
There is a clear non-linear trend to the data, or there are one or more outliers.
Example:


