I have been involved in HPC for over 30 years:
- 12 years as student & faculty user in ocean modeling,
- 12 years as a performance analyst and system architect at SGI, IBM, and AMD, and
- over 7 years as a research scientist at TACC.


- This history is based on my own study of the market, with many of the specific details from my own re-analysis of the systems in the TOP500 lists.
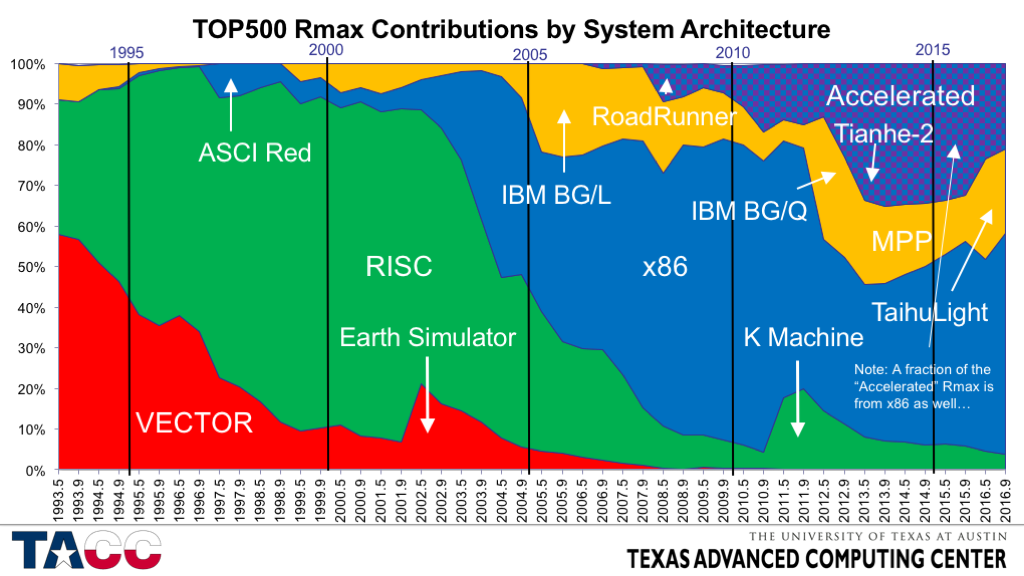
- Vector systems were in decline by the time the first TOP500 list was collected in 1993, but still dominated the large systems space in the early 1990’s.
- The large bump in Rmax in 2002 was due to the introduction of the “Earth Simulator” in Japan.
- The last vector system (2nd gen Earth Simulator) fell off the list in 2014.
- RISC SMPs and Clusters dominated the installed base in the second half of the 1990’s and the first few years of the 2000’s.
- The large bump in Rmax in 2011 is the “K Machine” in Japan, based on a Fujitsu SPARC processor.
- The “RISC era” was very dynamic, seeing the rapid rise and fall of 6-7 different architectures in about a decade.
- In alphabetical order the major processor architectures were: Alpha, IA-64, i860, MIPS, PA-RISC, PowerPC, POWER, SPARC.
- x86-based systems rapidly replaced RISC systems starting in around 2003.
- The first big x86 system on the list was ASCI Red in 1996.
- The large increase in x86 systems in 2003-2004 was due to several large systems in the top 10, rather than due to a single huge system.
- The earliest of these systems were 32-bit Intel processors.
- The growth of the x86 contribution was strongly enhanced by the introduction of the AMD x86-64 processors in 2004, with AMD contributing about 40% of the x86 Rmax by the end of 2006.
- Intel 64-bit systems replaced 32-bit processors rapidly once they become available.
- AMD’s share of the x86 Rmax dropped rapidly after 2011, and in the November 2016 list has fallen to about 1% of the Intel x86 Rmax.
- My definition of “MPP” differs from Dongarra’s and is based on how the development of the most expensive part of the system (usually the processor) was funded.
- Since 2005 almost all of the MPP’s in this chart have been IBM Blue Gene systems.
- The big exception is the new #1 system, the Sunway Taihulight system in China.
- Accelerated systems made their appearance in 2008 with the “RoadRunner” system at LANL.
- “RoadRunner” was the only significant system using the IBM Cell processor.
- Subsequent accelerated systems have almost all used NVIDIA GPUs or Intel Xeon Phi processors.
- The NVIDIA GPUs took their big jump in 2010 with the introduction of the #2-ranked “Nebulae” (Dawning TC3600 Blade System) system in China (4640 GPUS), then took another boost in late 2012 with the upgrade of ORNL’s Jaguar to Titan (>18000 GPUs).
- The Xeon Phi contribution is dominated by the immensely large Tianhe-2 system in China (48000 coprocessors), and the Stampede system at TACC (6880 coprocessors).
- Note the rapid growth, then contraction, of the accelerated systems Rmax.
- More on this topic below in the discussion of “clusters of clusters”.

- Obviously a high-level summary, but backed by a large amount of (somewhat fuzzy) data over the years.
- With x86, we get (slowly) decreasing price per “core”, but it is not obvious that we will get another major technology replacement soon.
- The embedded and mobile markets are larger than the x86 server/PC/laptop market, but there are important differences in the technologies and market requirements that make such a transition challenging.
- One challenge is the increasing degree of parallelism required — think about how much parallelism an individual researcher can “own”.
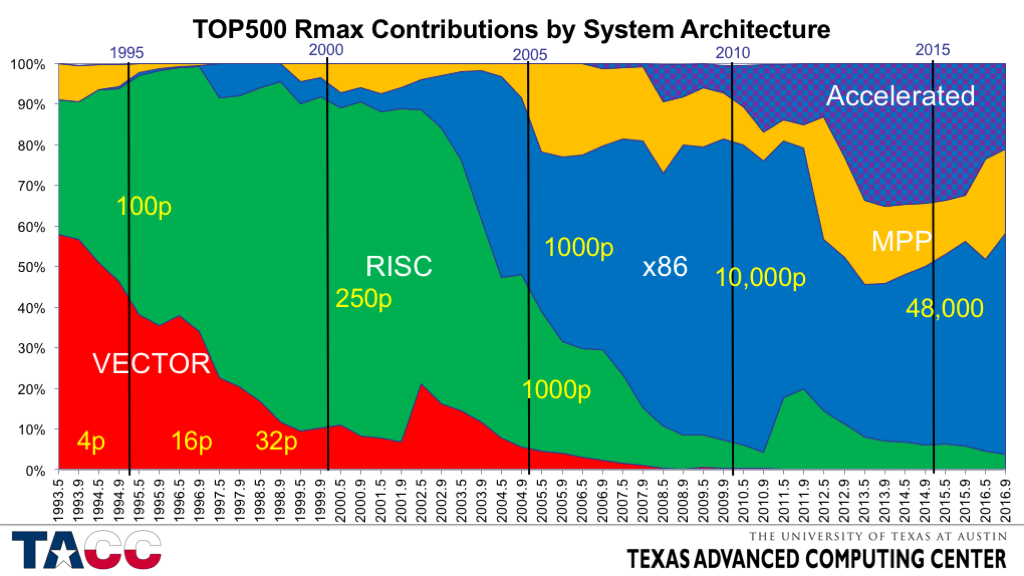
- Systems on the TOP500 list are almost always shared, typically by scores or hundreds of users.
- So up to a few hundred users, you don’t need to run parallel applications – your share is less than 1 ”processor”.
- Beyond a few thousand cores, a user’s allocation will typically be multiple core-years per year, so parallelism is required.
- A fraction of users can get away with single-node parallelism (perhaps with independent jobs running concurrently on multiple nodes), but the majority of users will need multi-node parallel implementations for turnaround, for memory capacity, or simply for throughput.

Instead of building large homogeneous systems, many sites have recognized the benefit of specialization – a type of HW/SW “co-configuration”.
These configurations are easiest when the application profile is stable and well-known. It is much more challenging for a general-purpose site such as TACC.


- This aside introduces the STREAM benchmark, which is what got me thinking about “balance” 25 years ago.
- I have never visited the University of Virginia, but had colleagues there who agreed that STREAM should stay in academia when I moved to industry in 1996, and offered to host my guest account.

- Note that the output of each kernel is used as an input to the next.
- The earliest versions of STREAM did not have this property and some compilers removed whole loops whose output was not used.
- Fortunately it is easy to identify cases where this happens so that workarounds can be applied.
- Another way to say this is that STREAM is resistant to undetected over-optimization.
- OpenMP directives were added in 1996 or 1997.
- STREAM in C was made fully 64-bit capable in 2013.
- The validation code was also fixed to eliminate a problem with round-off error that used to occur for very large array sizes.
- Output print formats keep getting wider as systems get faster.

- STREAM measures time, not bandwidth, so I have to make assumptions about how much data is moved to and from memory.
- For the Copy kernel, there are actually three different conventions for how many bytes of traffic to count!
- I count the reads that I asked for and the writes that I asked for.
- If the processor requires “write allocates” the maximum STREAM bandwidth will be lower than the peak DRAM bandwidth.
- The Copy and Scale kernels require 3/2 as much bandwidth as STREAM gives credit for if write allocates are included.
- The Add and Triad kernels require 4/3 as much bandwidth as STREAM gives credit for if write allocates are included.
- One weakness of STREAM is that all four kernels are in “store miss” form – none of the arrays are read before being written in a kernel.
- A counter-example is the DAXPY kernel: A[i] = A[i] + scalar*B[i], for which the store hits in the cache because A[i] was already loaded as an input to the addition operation.
- Non-allocating/non-temporal/streaming stores are typically required for best performance with the existing STREAM kernels, but these are not supported by all architectures or by all compilers.
- For example, GCC will not generate streaming stores.
- In my own work I typically supplement STREAM with “read-only” code (built around DDOT), a standard DAXPY (updating one of the two inputs), and sometimes add a “write-only” benchmark.

Back to the main topic….
For performance modeling, I try to find a small number of “performance axes” that are capable of accounting for most of the execution time.

- Using the same performance axes as on the previous slide….
- All balances are shifting to make data motion relatively more expensive than arithmetic.

- The first “Balance Ratio” to look at is (FP rate) / (Memory BW rate).
- This is the cost per (64-bit) “word” loaded relative to the cost of a (peak) 64-bit FP operation, and applies to long streaming accesses (for which latency can be overlapped).
- I refer to this metric as the “STREAM Balance” or “Machine Balance” or “System Balance”.
- The data points here are from a set of real systems.
- The systems I chose were both commercially successful and had very good memory subsystem performance relative to their competitors.
- ~1990: IBM RISC System 6000 Model 320 (IBM POWER processor)
- ~1993: IBM RISC System 6000 Model 590 (IBM POWER processor)
- ~1996: SGI Origin2000 (MIPS R10000 processor)
- ~1999: DEC AlphaServer DS20 (DEC Alpha processor)
- ~2005: AMD Opteron 244 (single-core, DDR1 memory)
- ~2006: AMD Opteron 275 (dual-core, DDR1 memory)
- ~2008: AMD Opteron 2352 (dual-core, DDR2 memory)
- ~2011: Intel Xeon X5680 (6-core Westmere EP)
- ~2012: Intel Xeon E5 (8-core Sandy Bridge EP)
- ~2013: Intel Xeon E5 v2 (10-core Ivy Bridge EP)
- ~2014: Intel Xeon E5 v3 (12-core Haswell EP)
- (future: Intel Xeon E5 v5)
- The systems I chose were both commercially successful and had very good memory subsystem performance relative to their competitors.
- Because memory bandwidth is understood to be an important performance limiter, the processor vendors have not let it degrade too quickly, but more and more applications become bandwidth-limited as this value increases (especially with essentially fixed cache size per core).
- Unfortunately every other metric is much worse….

- ERRATA: There is an error in the equation in the title — it should be “(GFLOPS/s)*(Memory Latency)”
- Memory latency is becoming expensive much more rapidly than memory bandwidth!
- Memory latency is dominated by the time required for cache coherence in most recent systems.
- Slightly decreasing clock speeds with rapidly increasing core counts leads to slowly increasing memory latency – even with heroic increases in hardware complexity.
- Memory latency is not a dominant factor in very many applications, but it was not negligible in 7 of the 17 SPECfp2006 codes using hardware from 2006, so it is likely to be of increasing concern.
- More on this below — slide 38.
- The principal way to combat the negative impact of memory latency is to make hardware prefetching more aggressive, which increases complexity and costs a significant amount of power.

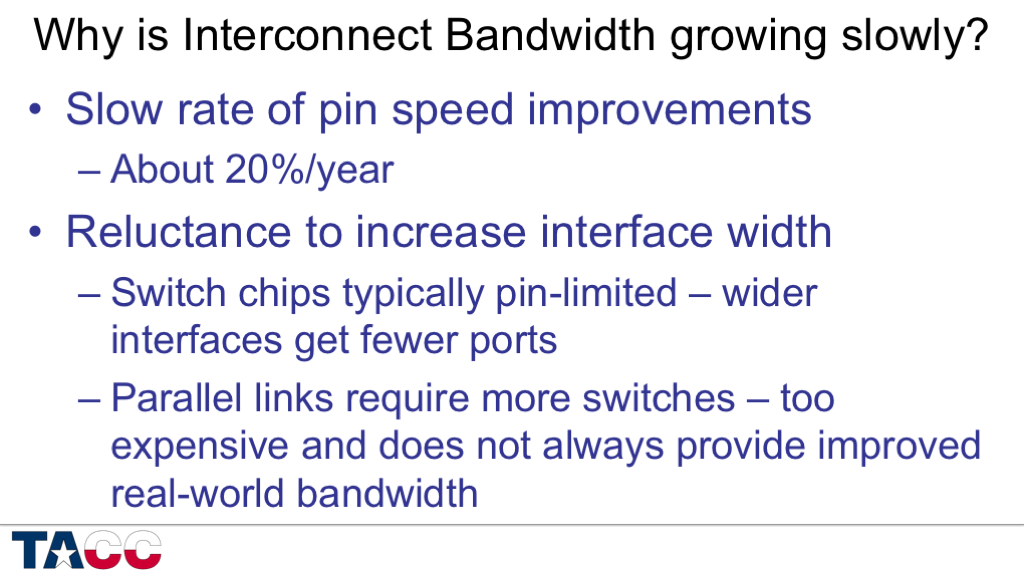
- Interconnect bandwidth (again for large messages) is falling behind faster than local memory bandwidth – primarily because interconnect widths have not increased in the last decade (while most chips have doubled the width of the DRAM interfaces over that period).
- Interconnect *latency* (not shown) is so high that it would ruin the scaling of even a log chart. Don’t believe me? OK…

- Interconnect latency is decreasing more slowly than per-core performance, and much more slowly than per-chip performance.
- Increasing the problem size only partly offsets the increasing relative cost of interconnect latency.
- The details depend on the scaling characteristics of your application and are left as an exercise….

- Early GPUs had better STREAM Balance (FLOPS/Word) because the double-precision FLOPS rate was low. This is no longer the case.
- In 2012, mainstream, manycore, and GPU had fairly similar balance parameters, with both manycore and GPGPU using GDDR5 to get enough bandwidth to stay reasonably balanced. We expect mainstream to be *more tolerant* of low bandwidth due to large caches and GPUs to be *less tolerant* of low bandwidth due to the very small caches.
- In 2016, mainstream processors have not been able to increase bandwidth proportionately (~3x increase in peak FLOPS and 1.5x increase in BW gives 2x increase in FLOPS/Word).
- Both manycore and GPU have required two generations of non-standard memory (GDDR5 in 2012 and MCDRAM and HBM in 2016) to prevent the balance from degrading too far.
- These rapid changes require more design cost which results in higher product cost.


- This chart is based on representative Intel processor models available at the beginning of each calendar year – starting in 2003, when x86 jumped to 36% of the TOP500 Rmax.
- The specific values are based on the median-priced 2-socket server processor in each time frame.
- The frequencies presented are the “maximum Turbo frequency for all cores operational” for processors through Sandy Bridge/Ivy Bridge.
- Starting with Haswell, the frequency presented is the power-limited frequency when running LINPACK (or similar) on all cores.
- This causes a significant (~25%) drop in frequency relative to operation with less computationally intense workloads, but even without the power limitation the frequency trend is slightly downward (and is expected to continue to drop.
- Columns shaded with hash marks are for future products (Broadwell EP is shipping now for the 2017 column).
- Core counts and frequencies are my personal estimates based on expected technology scaling and don’t represent Intel disclosures about those products.
- How do Intel’s ManyCore (Xeon Phi) processors compare?

- Comparing the components of the per-socket GFLOPS of the Intel ManyCore processors relative to the Xeon ”mainstream” processors at their introduction.
- The delivered performance ratio is expected to be smaller than the peak performance ratio even in the best cases, but these ratios are large enough to be quite valuable even if only a portion of the speedup can be obtained.
- The basic physics being applied here is based on several complementary principles:
- Simple cores are smaller (so you can fit more per chip) and use less power (so you can power & cool more per chip).
- Adding cores brings a linear increase in peak performance (assuming that the power can be supplied and the resulting heat dissipated).
- For each core, reducing the operating frequency brings a greater-than-proportional reduction in power consumption.
- These principles are taken even further in GPUs (with hundreds or thousands of very simple compute elements).

- The DIMM architecture for DRAMs has been great for flexibility, but terrible for bandwidth.
- Modern serial link technology runs at 25 Gbs per lane, while the fastest DIMM-based DDR4 interfaces run at just under 1/10 of that data rate.

- In 1990, the original “Killer Micros” had a single level of cache.
- Since about 2008, most x86 processors have had 3 levels of cache.
- Every design has to consider the potential performance advantage of speculatively probing the next level of cache (before finding out if the request has “hit” in the current level of cache) against the power cost of performing all those extra lookups.
- E.g., if the miss rate is typically 10%, then speculative probing will increase the cache tag lookup rate by 10x.
- The extra lookups can actually reduce performance if they delay “real” transactions.
- Every design has to consider the potential performance advantage of speculatively probing the next level of cache (before finding out if the request has “hit” in the current level of cache) against the power cost of performing all those extra lookups.
- Asynchronous clock crossings are hard to implement with low latency.
- A big, and under-appreciated, topic for another forum…
- Intel Xeon processors evolution:
- Monolithic L3: Nehalem/Westmere — 1 coherence protocol supported
- Sliced L3 on one ring: Sandy Bridge/Ivy Bridge — 2/3 coherence protocols supported
- Sliced L3 on two rings: Haswell/Broadwell — 3 coherence protocols supported

- Hardware is capable of extremely low-latency, low-overhead, high-bandwidth data transfers (on-chip or between chips), but only in integrated systems.
- Legacy IO architectures have orders of magnitude higher latency and overhead, and are only able to attain full bandwidth with very long messages.
- Some SW requirements, such as MPI message tagging, have been introduced without adequate input from HW designers, and end up being very difficult to optimize in HW.
- It may only take one incompatible “required” feature to prevent an efficient HW architecture from being used for communication.


- Thanks to Burton Smith for the Little’s Law reference!
- Before we jump into the numbers, I want to show an illustration that may make Little’s Law more intuitive….

- Simple graphical illustration of Little’s Law.
- I had to pick an old processor with a small latency-BW product to make the picture small enough to be readable.
- The first set of six loads is needed to keep the bus busy from 0 to 50 ns.
- As each cache line arrives, another request needs to be sent out so that the memory will be busy 60 ns in the future.
- The second set of six loads can re-use the same buffers, so only six buffers are needed

- In the mid-1990’s, processors were just transitioning from supporting a single outstanding cache miss to supporting 4 outstanding cache misses.
- In 2005, a single core of a first generation AMD Opteron could manage 8 cache misses directly, but only needed 5-6 to saturate the DRAM interface.
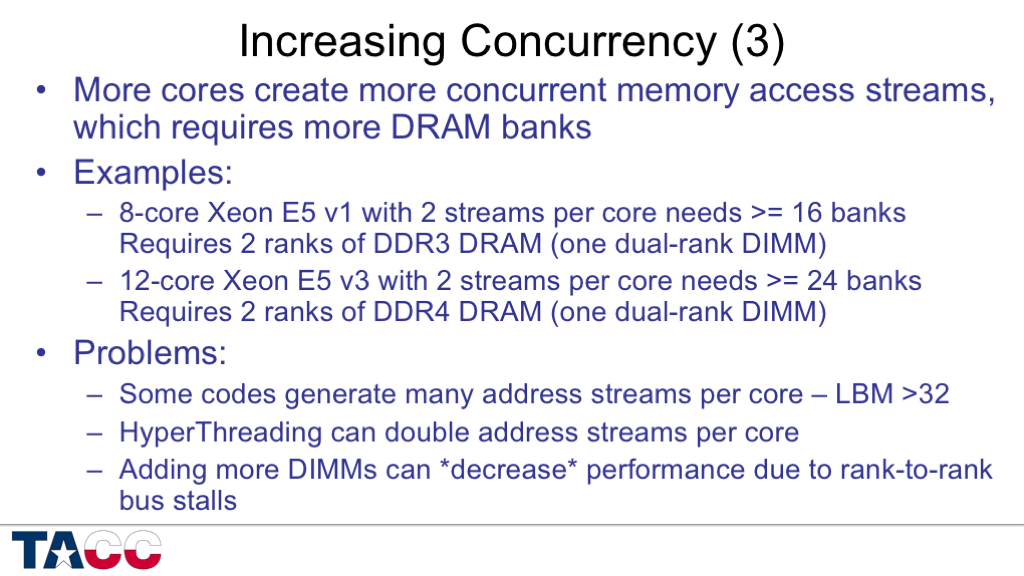
- By mid-2016, a Xeon E5 v4 (Broadwell) processor requires about 100 cache lines “in flight” to fully tolerate the memory latency.
- Each core can only directly support 10 outstanding L1 Data Cache misses, but the L2 hardware prefetchers can provide additional concurrency.
- It still requires 6 cores to get within 5% of asymptotic bandwidth, and the processor energy consumed is 6x to 10x the energy consumed in the DRAMs.
- The “Mainstream” machines are
- SGI Origin2000 (MIPS R10000)
- DEC Alpha DS20 (DEC Alpha EV5)
- AMD Opteron 244 (single-core, DDR1 memory)
- AMD Opteron 275 (dual-core, DDR1 memory)
- AMD Opteron 2352 (dual-core, DDR2 memory)
- Intel Xeon X5680 (6-core Westmere EP)
- Intel Xeon E5 (8-core Sandy Bridge EP)
- Intel Xeon E5 v2 (10-core Ivy Bridge EP)
- Intel Xeon E5 v3 (12-core Haswell EP)
- Intel Xeon E5 v4 (14-core Broadwell EP)
- (future: Intel Xeon E5 v5 — a plausible estimate for a future Intel Xeon processor, based on extrapolation of current technology trends.)
- The GPU/Manycore machines are:
- NVIDIA M2050
- Intel Xeon Phi (KNC)
- NVIDIA K20
- NVIDIA K40
- Intel Xeon Phi/KNL
- NVIDIA P100 (Latency estimated).




- Power density matters, but systems remain so expensive that power cost is still a relatively small fraction of acquisition cost.
- For example, a hypothetical exascale system that costs $100 million a year for power may not be not out of line because the purchase price of such a system would be the range of $2 billion.
- Power/socket is unlikely to increase significantly because of the difficulty of managing both bulk cooling and hot spots.
- Electrical cost is unlikely to increase by large factors in locations attached to power grids.
- So the only way for power costs to become dominant is for the purchase price per socket to be reduced by something like an order of magnitude.
- Needless to say, the companies that sell processors and servers at current prices have an incentive to take actions to keep prices at current levels (or higher).
- Even the availability of much cheaper processors is not quite enough to make power cost a first-order concern, because if this were to happen, users would deliberately pay more money for more energy-efficient processors, just to keep the ongoing costs tolerable.
- In this environment, budgetary/organizational/bureaucratic issues would play a major role in the market response to the technology changes.
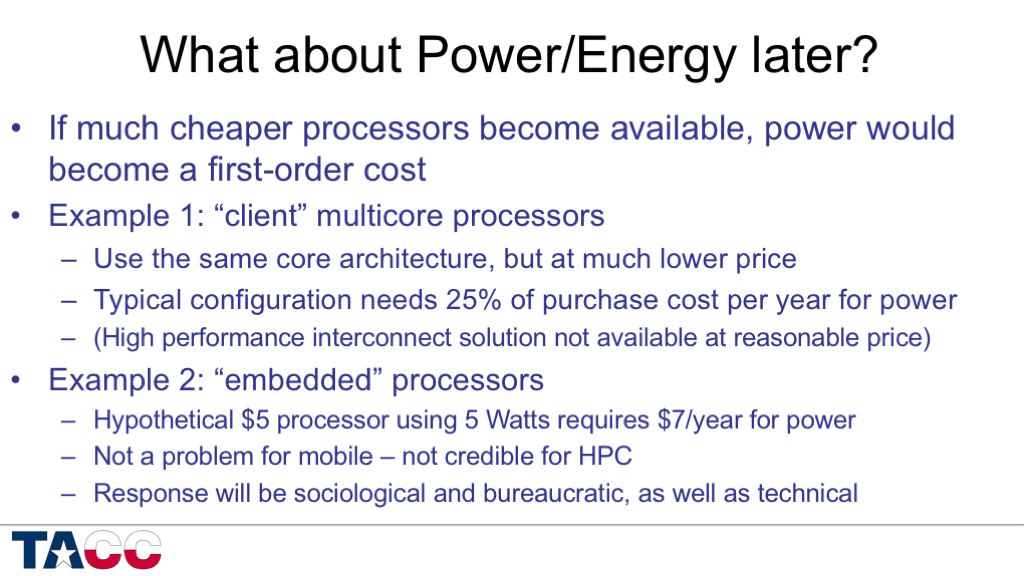
- Client processors could reduce node prices by using higher-volume, lower-gross-margin parts, but this does not fundamentally change the technology issues.
- 25%/year for power might be tolerable with minor adjustments to our organizational/budgetary processes.
- (Especially since staff costs are typically comparable to system costs, so 25% of hardware purchase price per year might only be about 12% of the annual computing center budget for that system.)
- Very low-cost parts (”embedded” or “DSP” processors) are in a different ballpark – lifetime power cost can exceed hardware acquisition cost.
- So if we get cheaper processors, they must be more energy-efficient as well.
- This means that we need to understand where the energy is being used and have an architecture that allows us to control high-energy operations.
- Not enough time for that topic today, but there are some speculations in the bonus slides.
- For the purposes of this talk, my speculations focus on the “most likely” scenarios.
- Alternatives approaches to maintaining the performance growth rate of systems are certainly possible, but there are many obstacles on those paths and it is difficult to have confidence that any will be commercially viable.

- Once an application becomes important enough to justify the allocation of millions of dollars per year of computing resources, it begins to make sense to consider configuring one or more supercomputers to be cost-effective for that application.
- (This is fairly widespread in practice.)
- If an application becomes important enough to justify the allocation of tens of millions of dollars per year of computing resources, it begins to make sense to consider designing one or more supercomputers to be cost-effective for that application.
- (This has clearly failed many times in the past, but the current technology balances makes the approach look attractive again.)
- Next we will look at examples of “application balance” from various application areas.

- CRITICAL! Application characterization is a huge topic, but it is easy to find applications that vary by two orders of magnitude or more in requirements for peak FP rate, for pipelined memory accesses (bandwidth), for unexpected memory access (latency), for large-message interconnect bandwidth, and for short-message interconnect latency.
- The workload on TACC’s systems covers the full range of node-level balances shown here (including at least a half-dozen of the specific codes listed).
- TACC’s workload includes comparable ranges in requirements for various attributes of interconnect and filesystem IO performance.
- This chart is based on a sensitivity-based performance model with additive performance components.
- In 2006/2007 there were enough different configurations available in the SPEC benchmark database for me to perform this analysis using public data.
- More recent SPEC results are less suitable for this data mining approach for several reasons (notably the use of autoparallelization and HyperThreading).
- But the modeling approach is still in active use at TACC, and was the subject of my keynote talk at the
2nd International Workshop on Performance Modeling: Methods and Applications (PMMA16)

- Catch-22 — the more you know about the application characteristics and the more choices you have for computing technology and configuration, the harder it is to come up with cost-effective solutions!
- It is very hard for vendors to back off of existing performance levels….
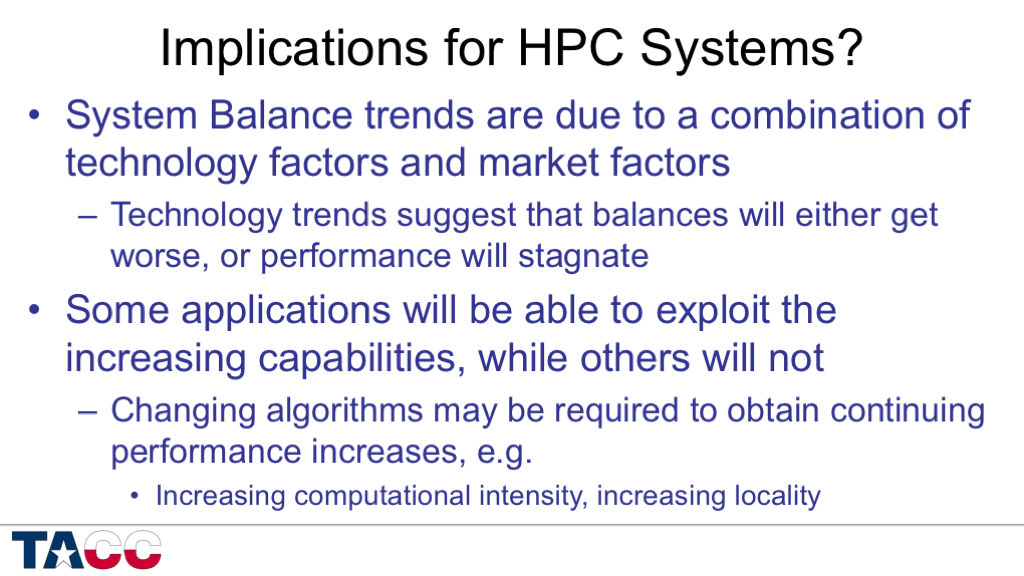
- As long as purchase prices remain high enough to keep power costs at second-order, there will be incentive to continue making the fast performance axes as fast as possible.
- Vendors will only have incentive to develop systems balanced to application-specific performance ratios if there is a large enough market that makes purchases based on optimizing cost/performance for particular application sub-sets.
- Current processor and system offerings provide a modest degree of configurability of performance characteristics, but the small price range makes this level of configurability a relatively weak lever for overall system optimization.

- This is not the future that I want to see, but it is the future that seems most likely – based on technological, economic, and organizational/bureaucratic factors.
- There is clearly a disconnect between systems that are increasingly optimized for dense, vectorized floating-point arithmetic and systems that are optimized for low-density “big data” application areas.
- As long as system prices remain high, vendors will be able to deliver systems that have good performance in both areas.
- If the market becomes competitive there will be incentives to build more targeted alternatives – but if the market becomes competitive there will also be less money available to design such systems.

- Here I hit the 45-minute mark and ended the talk.
- I will try to upload and annotate the “Bonus Slides” discussing potential disruptive technologies sometime in the next week.

Many thanks, the figures are quite interesting. As to the consequence of ever increasingly skewed/anistotropic performance envelopes,
That “A homogenous system cannot be optimal for a heterogenous workload” has been the case for a while, especially to IO and memory latency; unfortunately in my experience users and people giving funding just don’t want to hear that.
So I have seen too many cases where the argument prevailed that a single larger homogeneous system is more cost effective than multiple smaller workload specialized ones because of the assumption that there is no large penalty to pay for running very heterogenous workloads on an homogeneous system, and when catastrophic bottlenecks are exposed as the workloads interfere with each other, users are told to suck it up.