Here are the annotated slides from my SC18 presentation on Snoop Filter Conflicts that cause performance variability in HPL and DGEMM on the Xeon Platinum 8160 processor.
This slide presentation includes data (not included in the paper) showing that Snoop Filter Conflicts occur in all Intel Scalable Processors (a.k.a., “Skylake Xeon”) with 18 cores or more, and also occurs on the Xeon Phi x200 processors (“Knights Landing”).
The published paper is available (with ACM subscription) at https://dl.acm.org/citation.cfm?id=3291680

This is less boring than it sounds!
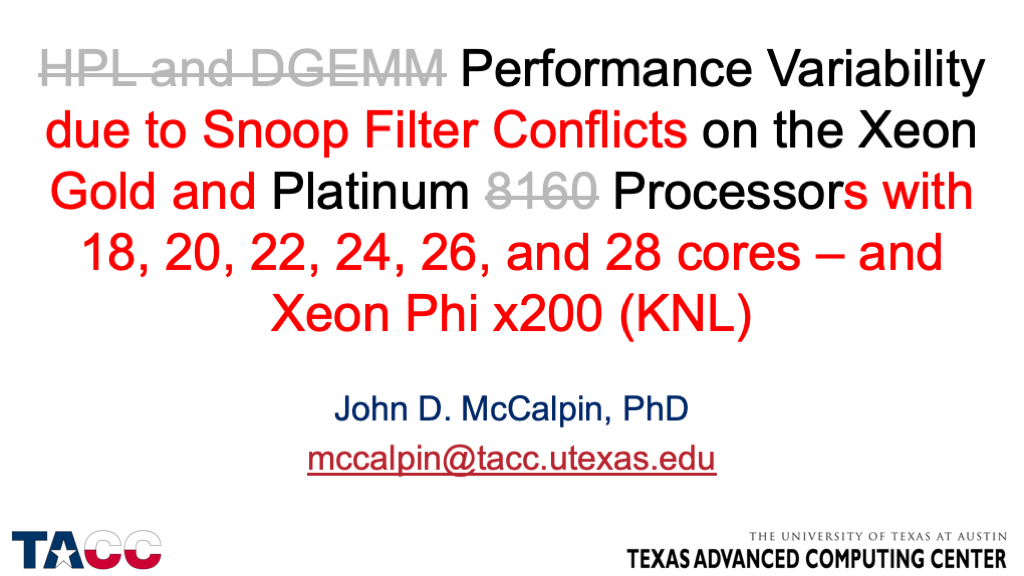
A more exciting version of the title.
 This story is very abridged — please read the paper!

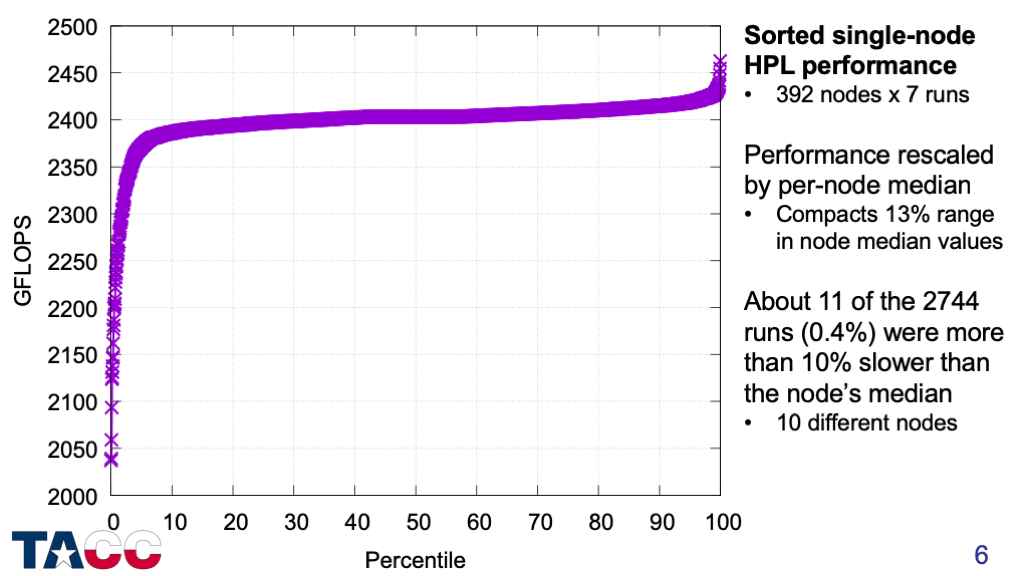
Execution times only — no performance counters yet.
500 nodes tested, but only 392 nodes had the 7 runs needed for a good computation of the median performance.
Dozens of different nodes showed slowdowns of greater than 5%.
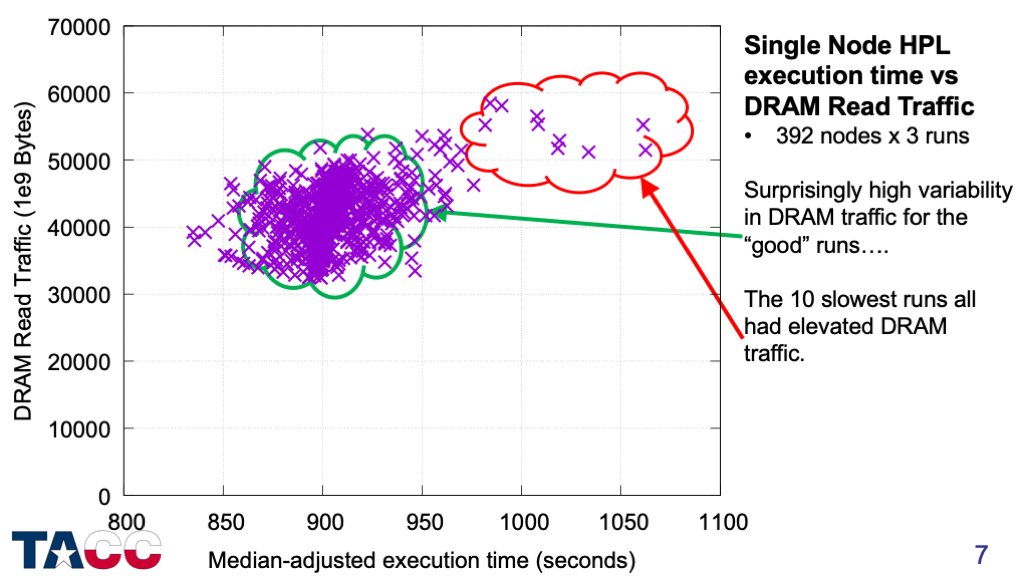
I measured memory bandwidth first simply because I had the tools to do this easily.
Read memory controller performance counters before and after each execution and compute DRAM traffic.
Write traffic was almost constant — only the read traffic showed significant variability.

It is important to decouple the sockets for several reasons. (1) Each socket manages its frequency independently to remain within the Running Average Power Limit. (2) Cache coherence is managed differently within and between sockets.
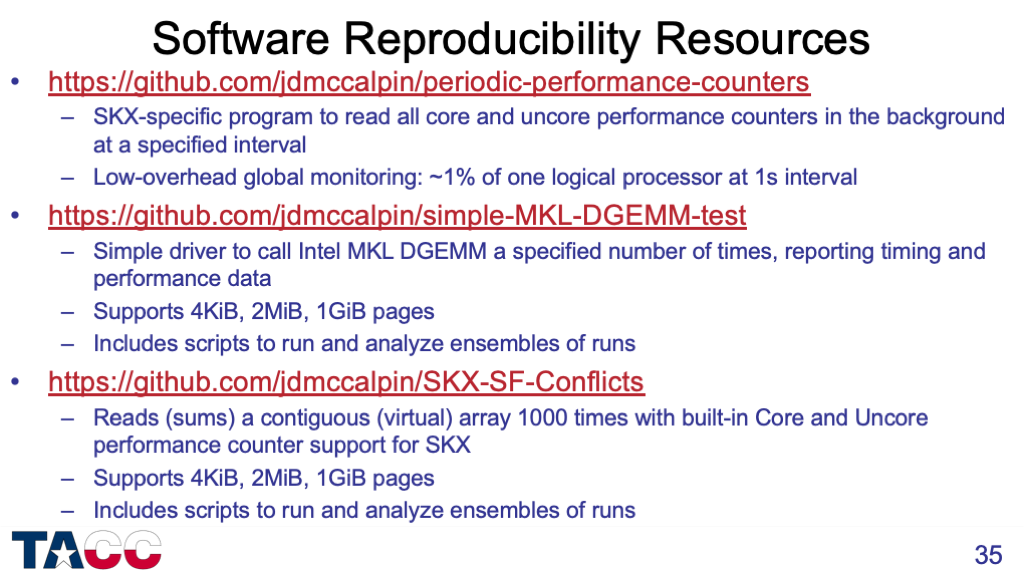
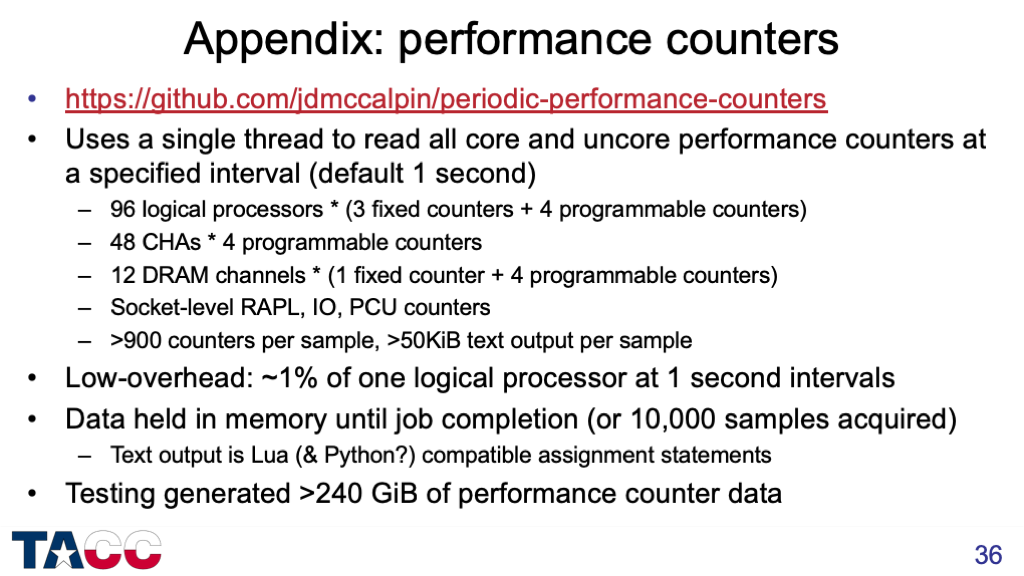
The performance counter infrastructure is at https://github.com/jdmccalpin/periodic-performance-counters
Over 25,000 DGEMM runs in total, generating over 240 GiB of performance counter output.
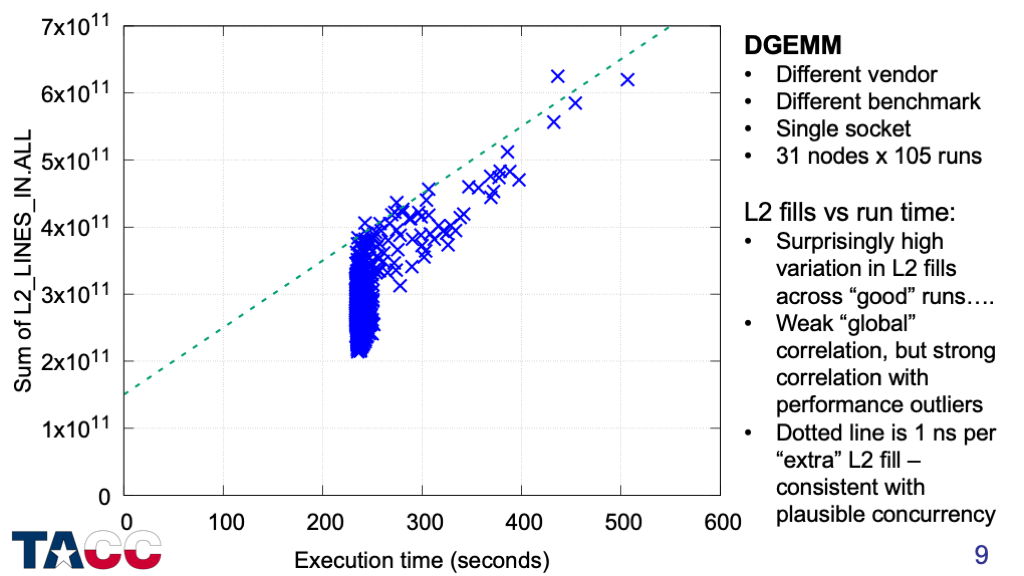
I already saw that slow runs were associated with higher DRAM traffic, but needed to find out which level(s) of the cache were experience extra load misses.
The strongest correlation between execution time and cache miss counts was with L2 misses (measured here as L2 cache fills).
The variation of L2 fills for the full-speed runs is surprisingly large, but the slow runs all have L2 fill counts that are at least 1.5x the minimum value.
Some runs tolerate increased L2 fill counts up to 2x the minimum value, but all cases with >2x L2 fills are slow.
This chart looks at the sum of L2 fills for all the cores on the chip — next I will look at whether these misses are uniform across the cores.
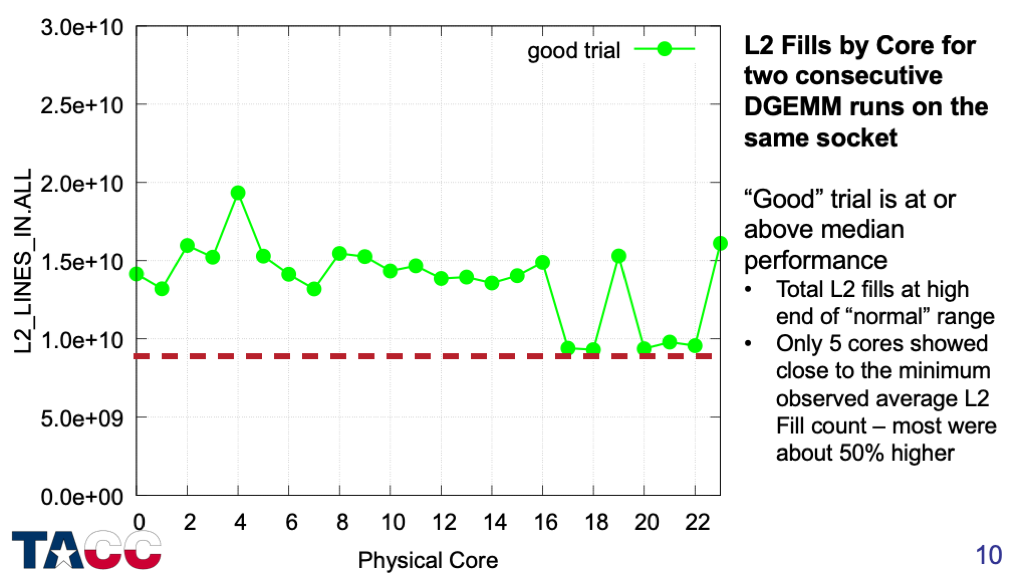
I picked 15-20 cases in which a “good” trial (at or above median performance) was followed immediately by a “slow” trial (at least 20% below median performance).
This shows the L2 Fills by core for a “good” trial — the red dashed line corresponds to the minimum L2 fill count from the previous chart divided by 24 to get the minimum per-core value.
Different sets of cores and different numbers of cores had high counts in each run — even on the same node.
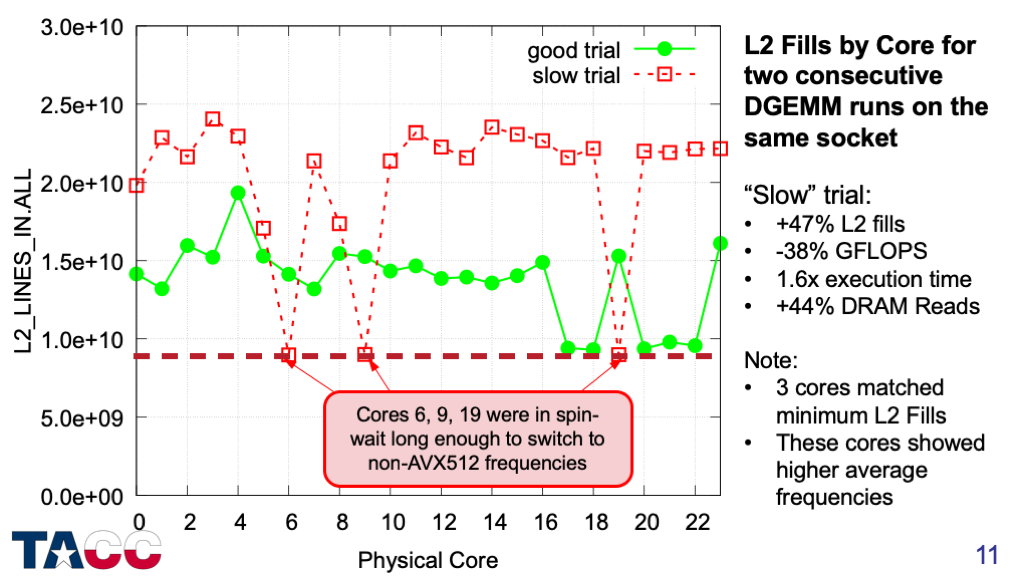
This adds the “slow” execution that immediately followed the “good” execution.
For the slow runs, most of cores had highly elevated L2 counts. Again, different sets of cores and different numbers of cores had high counts in each run.
This data provides a critical clue: Since L2 caches are private and 2MiB caches fully control the L2 cache index bits, the extra L2 cache misses must be caused by something *external* to the cores.
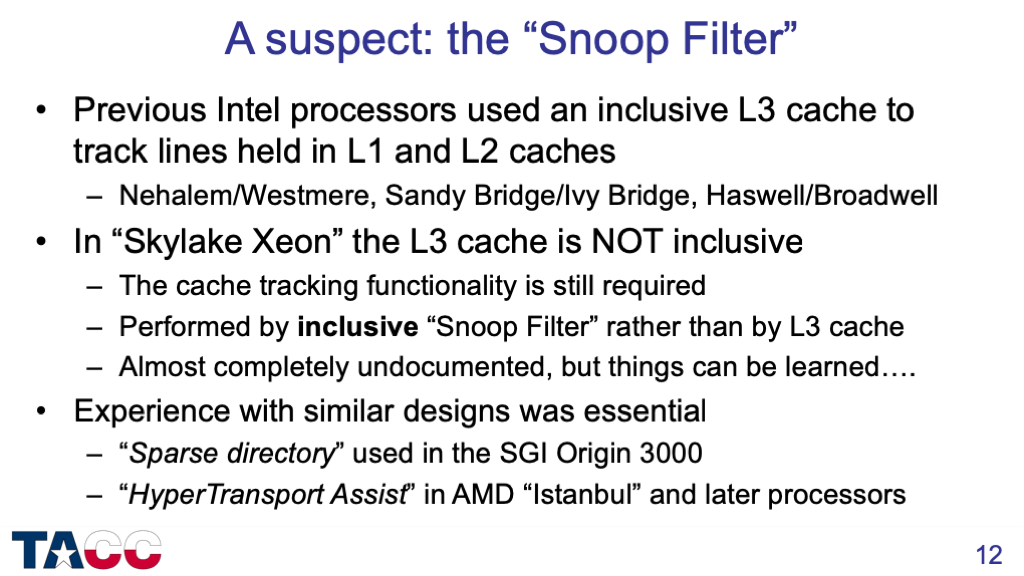
The Snoop Filter is essentially the same as the directory tags of the inclusive L3 cache of previous Intel Xeon processors, but without room to store the data for the cache lines tracked.
The key concept is “inclusivity” — lines tracked by a Snoop Filter entry must be invalidated before that Snoop Filter entry can be freed to track a different cache line address.
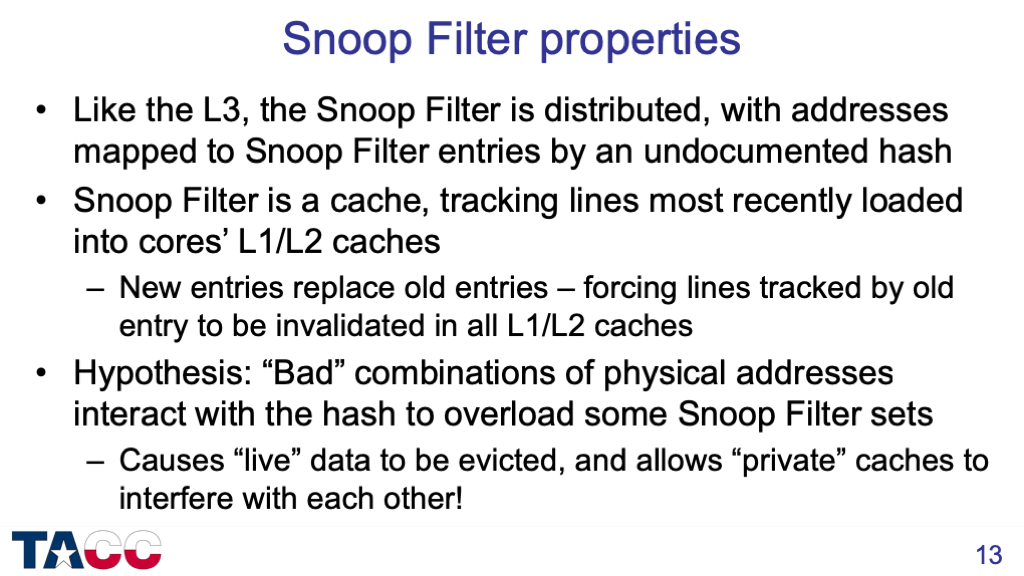
I initially found some poorly documented core counters that looked like they were related to Snoop Filter evictions, then later found counters in the “uncore” that count Snoop Filter evictions directly.
This allowed direct confirmation of my hypothesis, as summarized in the next slides.
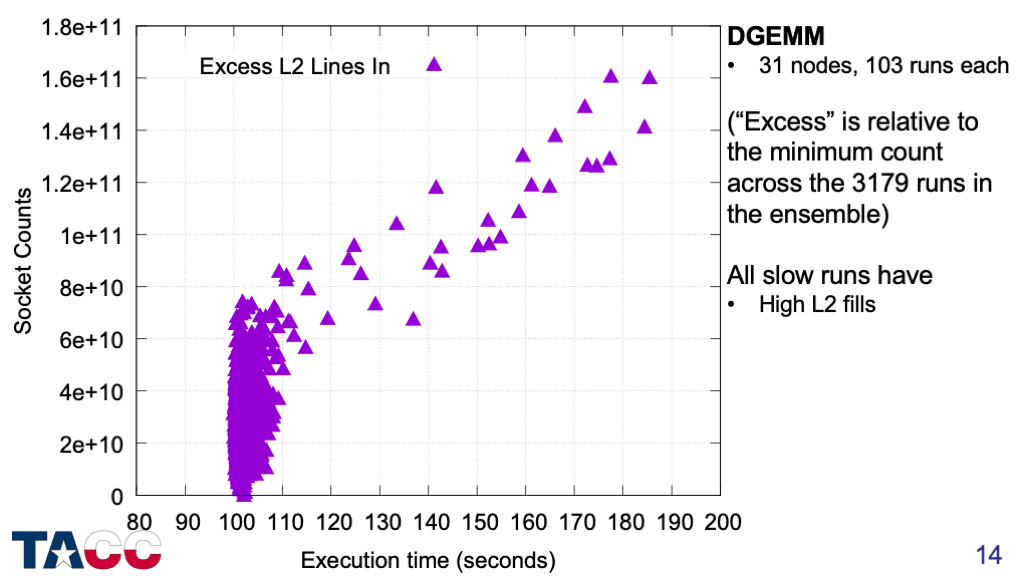
About 1% of the runs are more than 10% slower than the fastest run.

Snoop Filter Evictions clearly account for the majority of the excess L2 fills.
But there is one more feature of the “slow” runs….
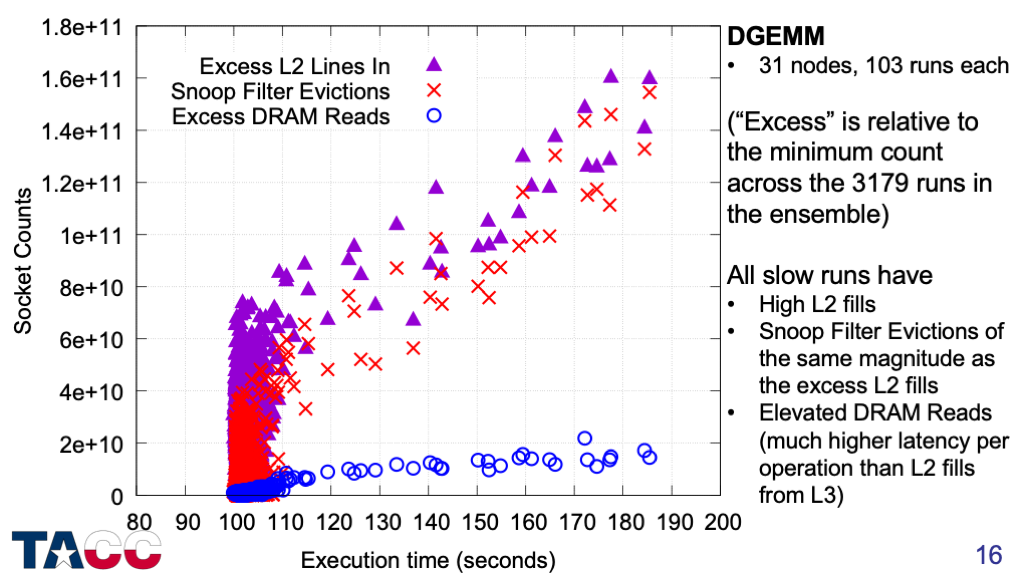
For all of the “slow” runs, the DRAM traffic is increased. This means that a fraction of the data evicted from the L2 caches by the Snoop Filter evictions was also evicted from the L3 cache, and so must be retrieved from DRAM.
At high Snoop Filter conflict rates (>4e10 Snoop Filter evictions), all of the cases have elevated DRAM traffic, with something like 10%-15% of the Snoop Filter evictions missing in the L3 cache.
There are some cases in the range of 100-110 seconds that have elevated snoop filter evictions, but not elevated DRAM reads, that show minimal slowdowns.
This suggests that DGEMM can tolerate the extra latency of L2 miss/L3 hit for its data, but not the extra latency of L2 miss/L3 miss/DRAM hit.

Based on my experience in processor design groups at SGI, IBM, and AMD, I wondered if using contiguous physical addresses might avoid these snoop filter conflicts….
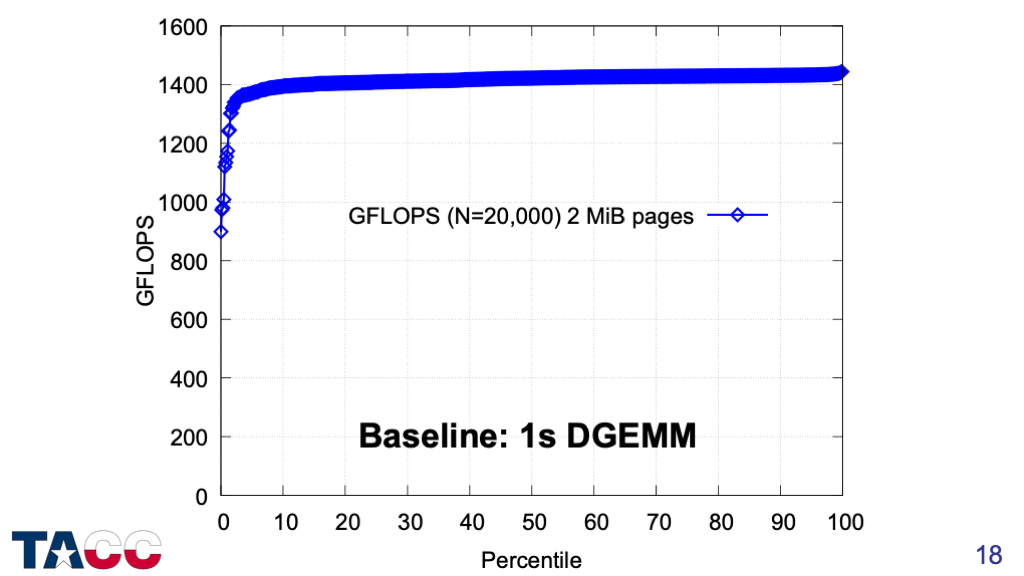
Baseline with 2MiB pages.
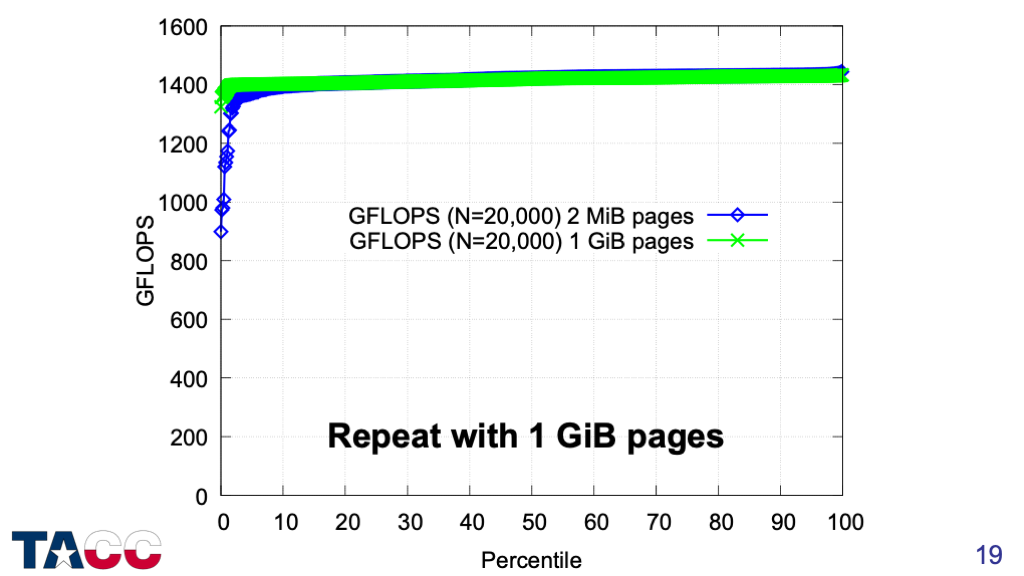
With 1GiB pages, the tail almost completely disappears in both width and depth.
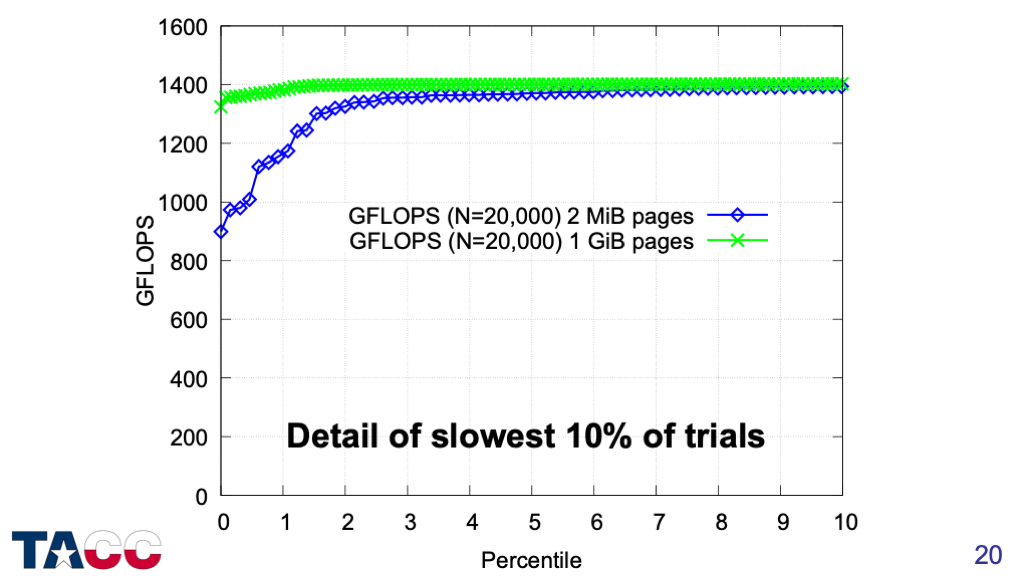
Zooming in on the slowest 10% of the runs shows no evidence of systematic slowdowns when using 1GiB pages.
The performance counter data confirms that the snoop filter eviction rate is very small.
So we have a fix for single-socket DGEMM, what about HPL?
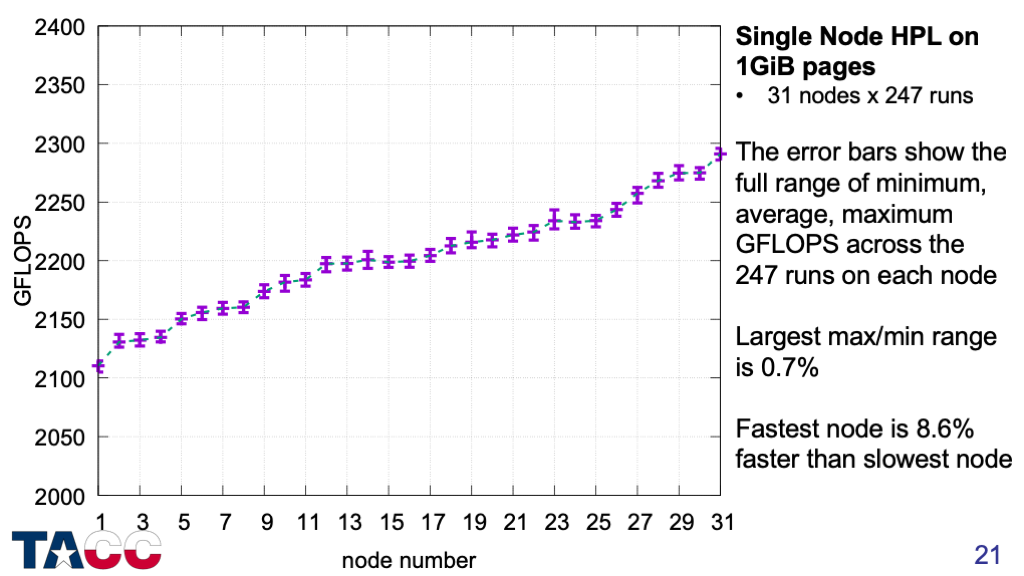
Intel provided a test version of their optimized HPL benchmark in December 2017 that supported 1GiB pages.
First, I verified that the performance variability for single-node (2-socket) HPL runs was eliminated by using 1GiB pages.
The variation across nodes is strong (due to different thermal characteristics), but the variation across runs on each node is extremely small.
The 8.6% range of average performance for this set of 31 nodes increases to >12% when considering the full 1736-node SKX partition of the Stampede2 system.
So we have a fix for single-node HPL, what about the full system?
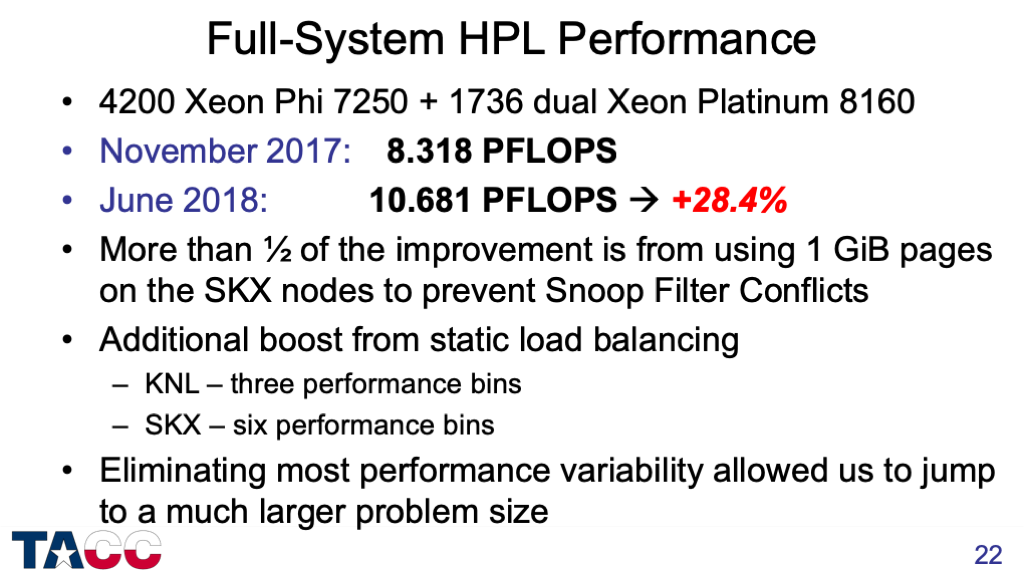
Intel provided a full version of their optimized HPL benchmark in March 2018 and we ran it on the full system in April 2018.
The estimated breakdown of performance improvement into individual contributions is a ballpark estimate — it would be a huge project to measure the details at this scale.
The “practical peak performance” of this system is 8.77 PFLOPS on the KNLs plus 3.73 PFLOPS on the SKX nodes, for 12.5 PFLOPS “practical peak”. The 10.68 PFLOPS obtained is about 85% of this peak performance.

During the review of the paper, I was able to simplify the test further to allow quick testing on other systems (and larger ensembles).
This is mostly new material (not in the paper).
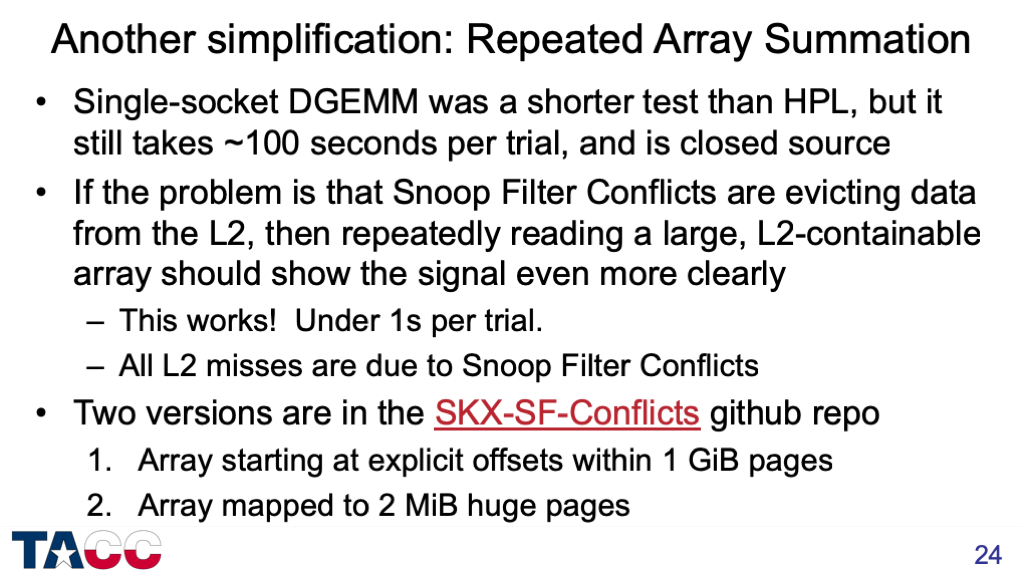
https://github.com/jdmccalpin/SKX-SF-Conflicts
This lets me more directly address my hypothesis about conflicts with contiguous physical addresses, since each 1GiB page is much larger than the 24 MiB of aggregate L2 cache.
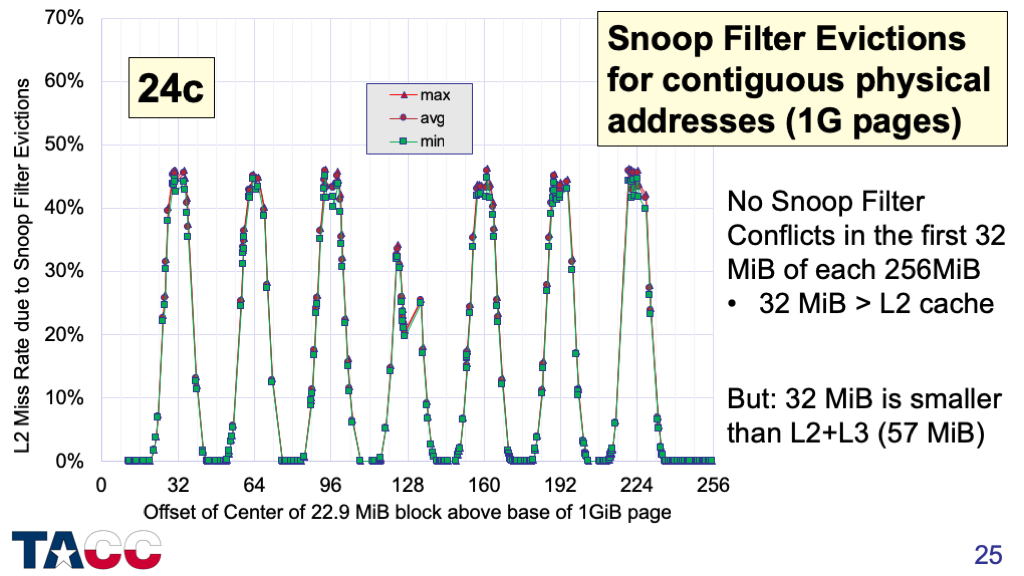
It turns out I was wrong — Snoop Filter Conflicts can occur with contiguous physical addresses on this processor.
The pattern repeats every 256 MiB.
If the re-used space is in the 1st 32 MiB of any 1GiB page, there will be no Snoop Filter Conflicts.
What about other processors?
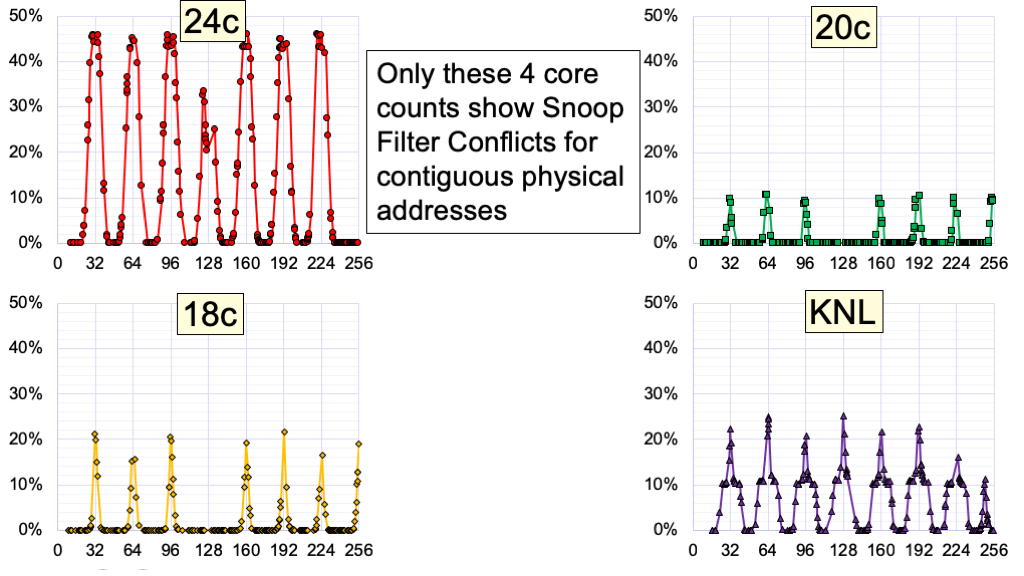
I tested Skylake Xeon processors with 14, 16, 18, 20, 22, 24, 26, 28 cores, and a 68-core KNL (Xeon Phi 7250).
These four processors are the only ones that show Snoop Filter Conflicts with contiguous physical addresses.
But with random 2MiB pages, all processors with more than 16 cores show Snoop Filter conflicts for some combinations of addresses…..
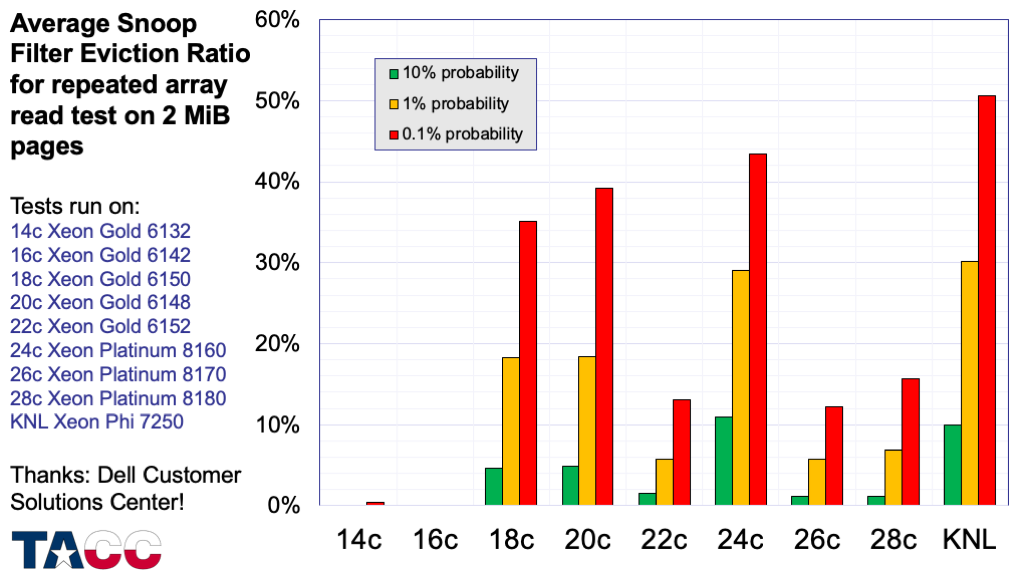
These are average L2 miss rates — individual cores can have significantly higher miss rates (and the maximum miss rate may be the controlling factor in performance for multi-threaded codes).
The details are interesting, but no time in the current presentation….
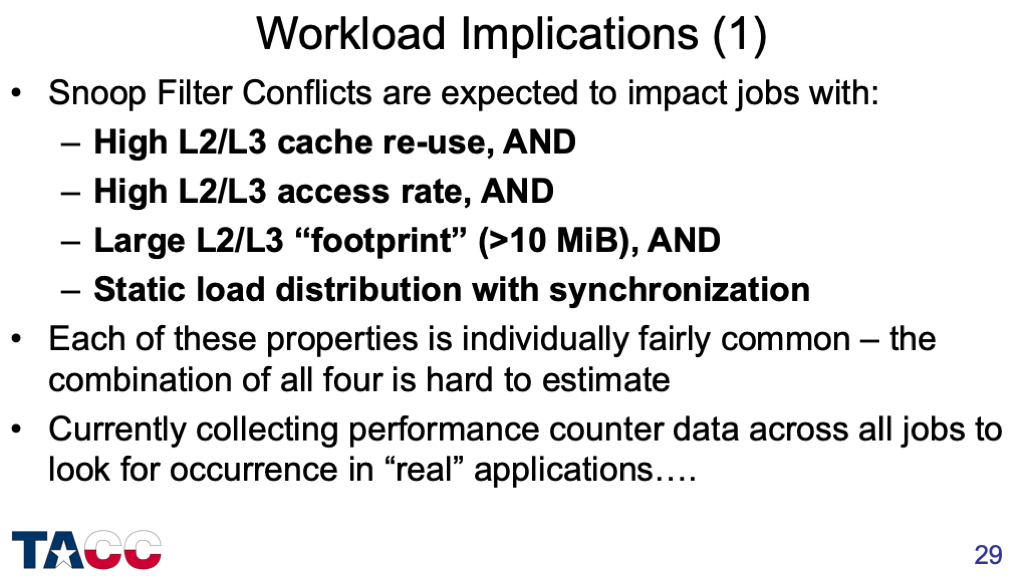
Overall, the uncertainty associated with this performance variability is probably more important than the performance loss.
Using performance counter measurements to look for codes that are subject to this issue is a serious “needle in haystack” problem — it is probably easier to choose codes that might have the properties above and test them explicitly.
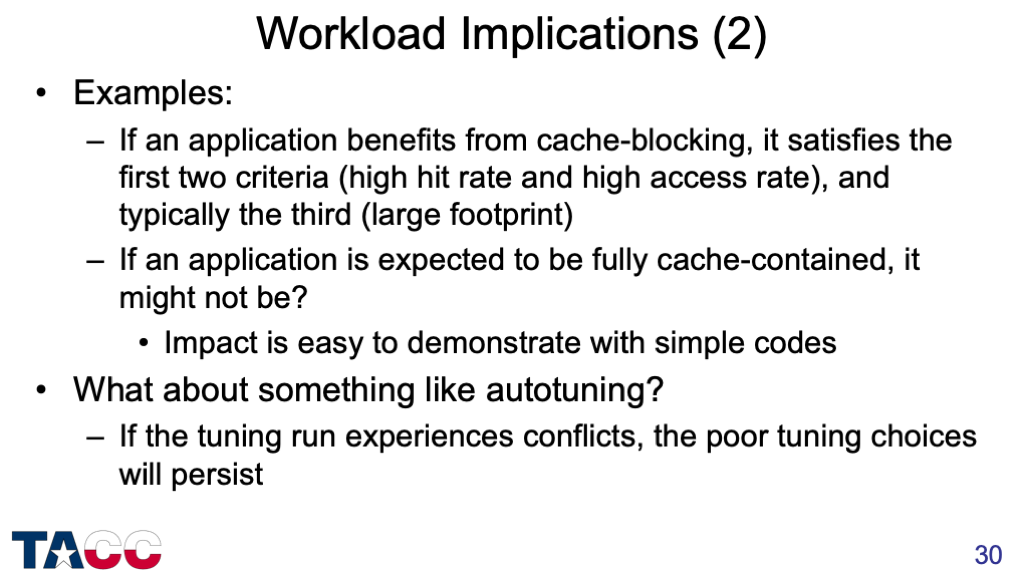
Cache-contained shallow water model, cache-contained FFTs.
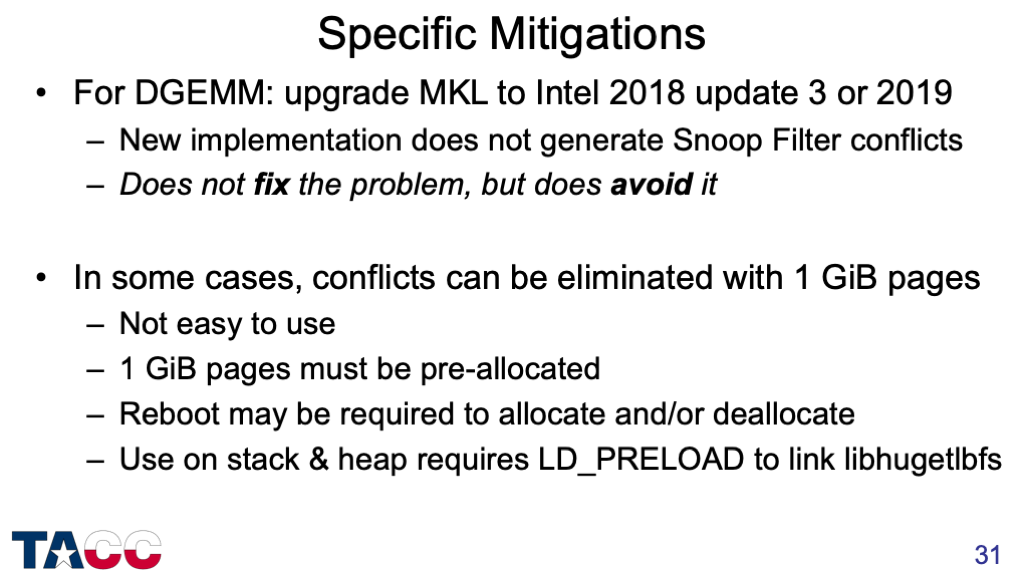
The new DGEMM implementation uses dynamic scheduling of the block updates to decouple the memory access patterns. There is no guarantee that this will alleviate the Snoop Filter Conflict problem, but in this case it does.
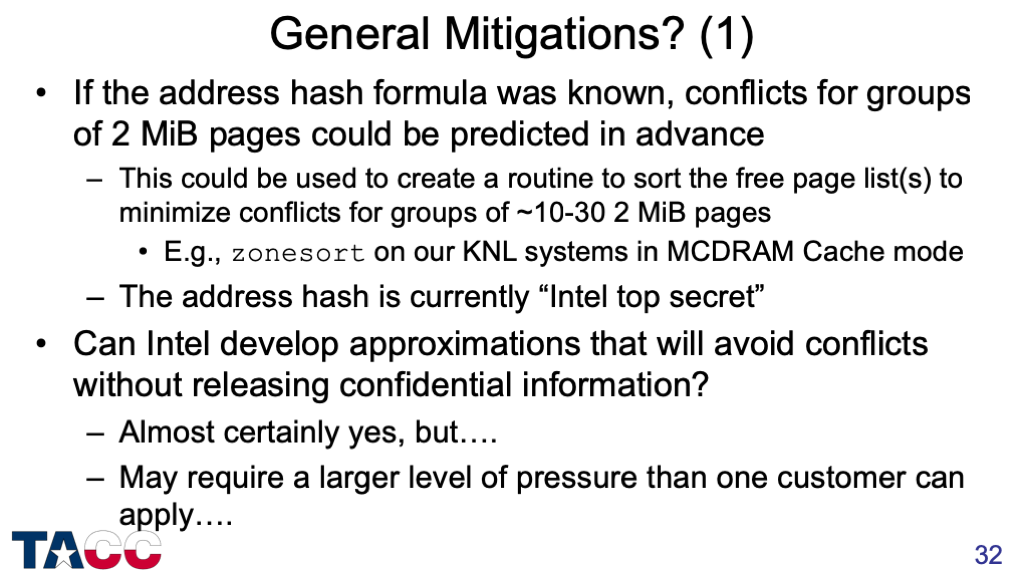
I now have a model that predicts all Snoop Filter Conflicts involving 2MiB pages on the 24-core SKX processors.
Unfortunately, the zonesort approach won’t work under Linux because pages are allocated on a “first-come, first-served” basis, so the fine control required is not possible.
An OS with support for page coloring (such as BSD) could me modified to provide this mitigation.
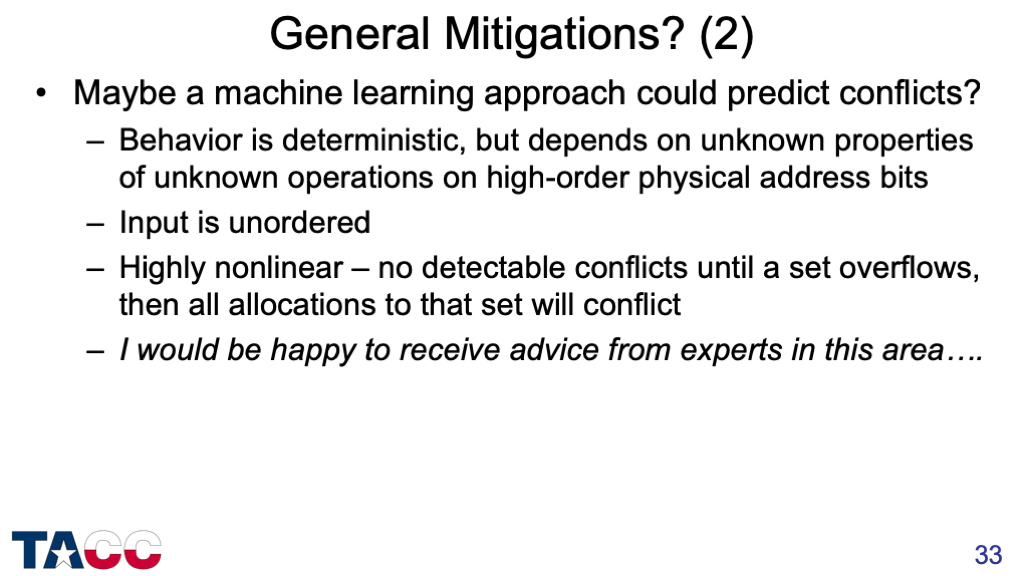
Again, the inability of Linux to use the virtual address as a criterion for selecting the physical page to use will prevent any sorting-based approach from working.
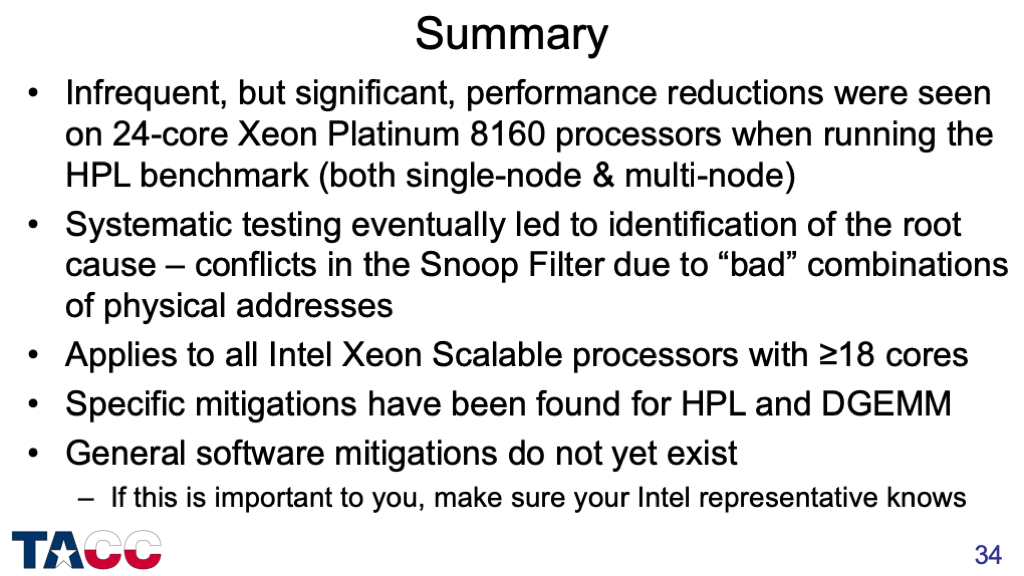
Intel has prepared a response. If you are interested, you should ask your Intel representative for a copy.
