
Project 1: Second Sound [1] _ Wave-like Heat Propagation
Phonons, the energy quanta of lattice vibration, scatter among themselves via normal (N) and Umklapp (U) processes that conserve and destroy phonon momentum, respectively. The phonon momentum non-conserving Umklapp scattering is the main source of the thermal resistivity which is called a diffusive regime and is described by Fourier’s law. When the sample size is smaller than the mean free paths of internal phonon-phonon and phonon-defect scatterings, phonon transport is in the ballistic regime where phonon-boundary scattering dominates. In comparison to the diffusive and ballistic regimes, phonon hydrodynamics describes a peculiar transport regime that is dominated by N-processes. In this framework, the phonon behaves like the gas, and the temperature field can propagate analogous to the sound (pressure field) propagation in the gas medium in the form of a wave with minimal damping. In other words, if we measure the same spot in the gas medium, we expect compression followed by decompression in the time domain. Similarly, if we measure the same spot in the lattice, we would see the temperature increase followed by the cooling event, and this thermal wave is referred to as the second sound. The second sound can transport heat much faster than diffusive heat transfer descried with Fourier’s Law and provides a new possibility to manipulate heat transport.
In our lab, we implanted the axicon lens into the ps-TTR system (which would be introduced below) to form a ring-shaped pump laser to generate the heat (Fig. 1(a)-(c)). A CW probe is located at the center of the ring as a bolometer. This special experiment geometry creates an adiabatic boundary condition at the center of the pump ring and makes it feasible to observe the dynamic process of second sound propagation. Our measurement results reveal that, due to hydrodynamic phonon transport, the pulse heating can create lattice cooling near the adiabatic boundary several micrometers away from the heat source in graphite at temperatures between 80 and 120 K (Fig. 1(d)).
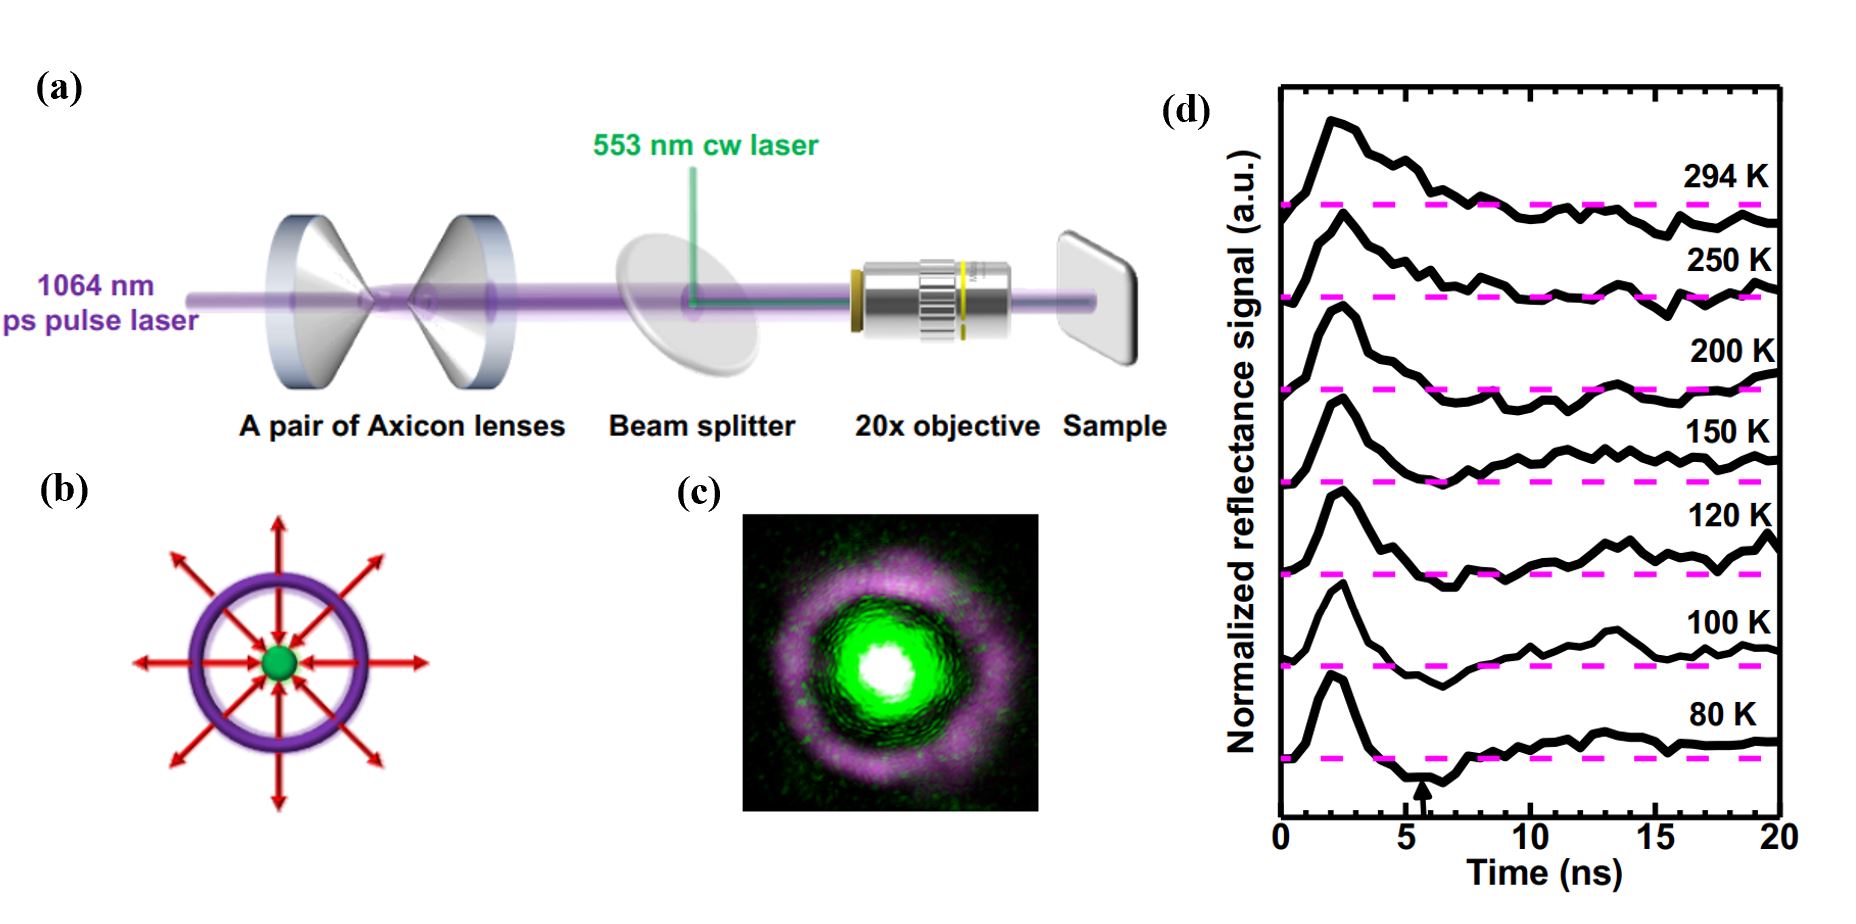
Fig. 1. Experimental setup of optical heat pulse measurement. (a) Schematic diagram of optical heat pulse measurement setup with a pair of axicon lenses to form a ring-shaped pump of 1064 nm picosecond pulse laser. Continuous-wave laser at 553 nm wavelength is focused on the center of the ring-shaped pump as a probe. (b) Schematic of the ring-shaped pump and probe at the center on the sample surface. Red arrows indicate heat propagating directions. (c) An example image of the laser beam on the sample surface. (d)normalized reflectance data measured on the HOPG at different temperatures indicated in the figure. The radius of the ring-shaped pump is 15 µm. The arrow indicates lattice cooling due to second sound propagation.
Other resource about second sound:
Project 2: Thermal Conductivity Characterization
In the past decade, noncontact thermoreflectance techniques have been
invented in various forms, such as time-domain thermoreflectance (TDTR), frequency-domain thermoreflectance (FDTR), transient thermoreflectance (TTR), transient thermal grating, and transient grating imaging. Even though different in experimental configurations and analytical models, the common feature of these techniques is the use of a strong pump laser as the heating source to elevate the surface temperature and a weak probe laser to monitor the surface temperature change. Our lab builds up two new methods to improve the measurements.
1: Picosecond Transient Thermoreflectance (ps-TTR) [2]
We developed a picosecond transient thermoreflectance system (ps-TTR) that utilizes
a low-repetition-rate picosecond laser as a pump and a CW laser as a probe(Fig. 2(a)-(c)). This ps-TTR system has several advantages that make it appealing for thermal property characterization. The advantages of ps-TTR include: (1) It detects a thermal decay signal excited by a single pulse. The time between pulses is 1 ms, long enough for the sample surface temperature to return to its original state. No heat accumulation effect is expected.(2) Using a CW probe eliminates the need for a mechanical delay stage. The delay time could be as long as 1 ms, only limited by the pump laser repetition rate. (3) Fast data acquisition could be achieved with a digital oscilloscope. (4) The traditional nanosecond TTR (ns-TTR) technique usually utilizes a laser pulse with a duration of 5 ~ 10 ns, which is not able to detect heat transport in nanostructures. With some iterative fitting procedures, ns-TTR can be sensitive to the interface conductance between a metal film and bulk samples, but not in nanostructures. This ps-TTR system can measure thermal conductivity in nanostructures as well as interfacial thermal conductance.
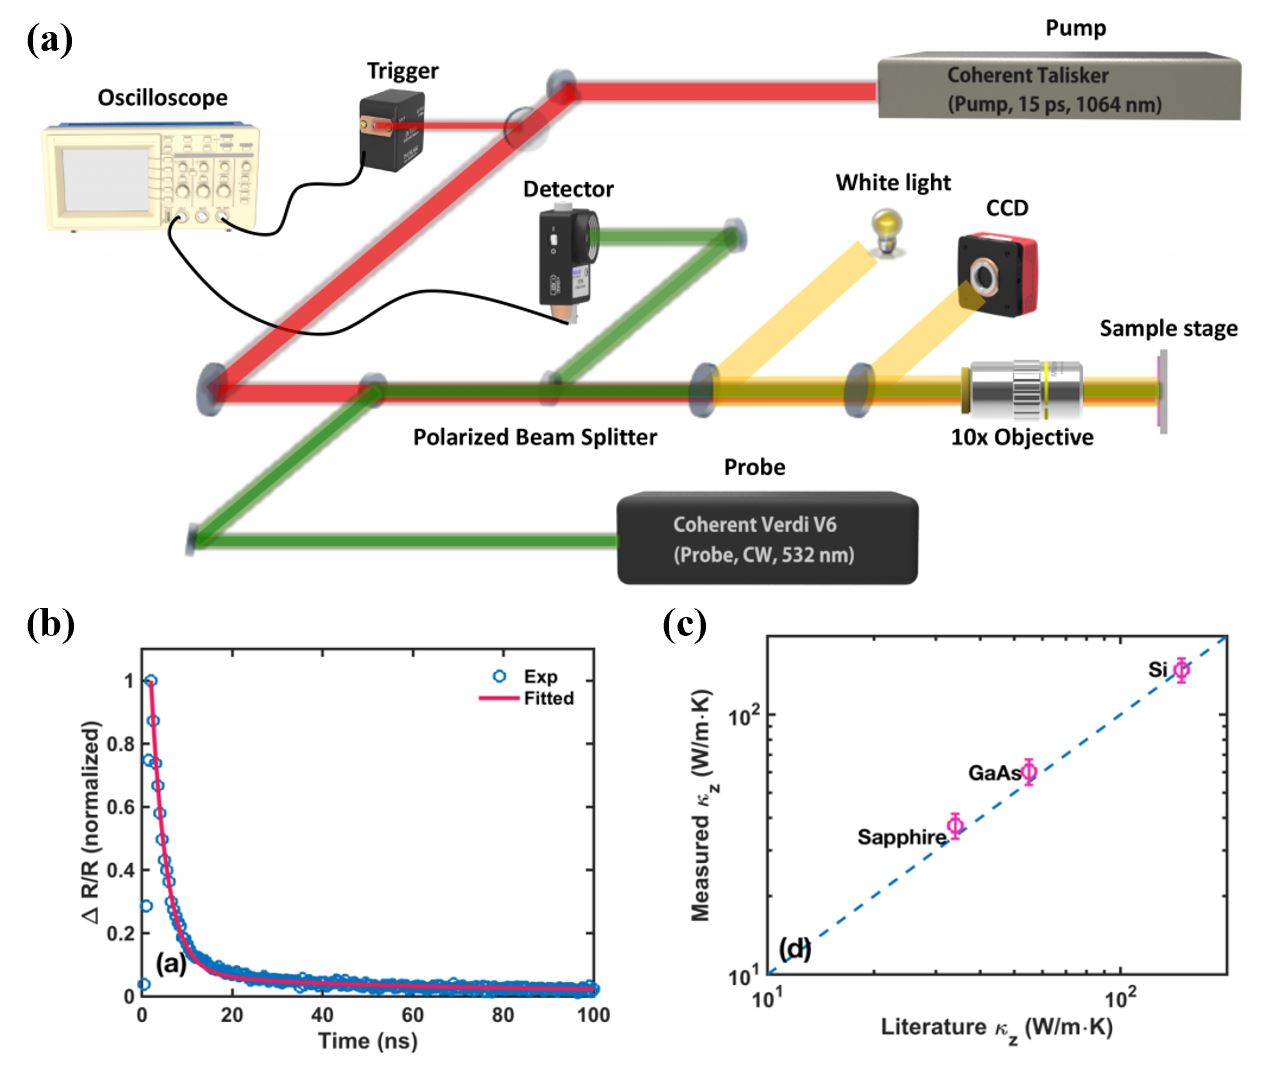
Figure 2(a)Schematics of ps-TTR set-up. (b)Experimental and fitting results for Au (50 nm) on sapphire. (c) Thermal conductivity of sapphire, GaAs, and Si measured with
the ps-TTR system, along with literature values.
2: Nanosecond Grating Imaging Technique(NGI) [3][4]
A grating imaging technique, recently developed in our group and similar to the heterodyned transient grating technique, can be used to determine isotropic thermal conductivity. NGI incorporates a photomask with periodic metal strips patterned on a transparent dielectric substrate to generate grating images of the pump and probe lasers on the sample surface, which induces heat conduction along both cross and in-plane directions (Fig. 3(a)-(b)). Analytical and numerical models have been developed to extract thermal conductivities from NGI measurements. This newly developed technique has been used to measure the thickness-dependent thermal conductivity of copper nanofilms (Fig. 3(c)-(d)) as well as the in-plane thermal conductivity of GaAs/AlAs superlattice.

Fig. 3. (a) Schematic diagram of the experimental setup of the grating imaging technique; (b) in-plane and cross-plane heat flow generated by the pump and detected by the probe. (c) Experimental and fitting results for Cu 220-nm-thick nano-film measured by ns-TTR (λ = ∞) and NGI with grating periods of 10 μm and 20 μm; (d) comparison of κx of Cu nano-films measured by NGI with four-point probe results as well as reference values.
3: Double-sided pump-probe
As mentioned, ps-TTR is conducted by focusing the pump and the probe on the same side of the sample. It measures the thermal effusivity of the sample, which is the square root of the multiplication between thermal conductivity and heat capacity. On the other hand, ps-LF is a technique in which the pump and the probe are placed on the opposite side of the sample, and thermal diffusivity is measured, which equals the ratio between thermal conductivity and heat capacity. Through the combination of ps-TTR and ps-laser flash technique, thermal effusivity and thermal diffusivity are measured simultaneously. Thus, thermal conductivity and heat capacity can be determined together (Fig. 4).
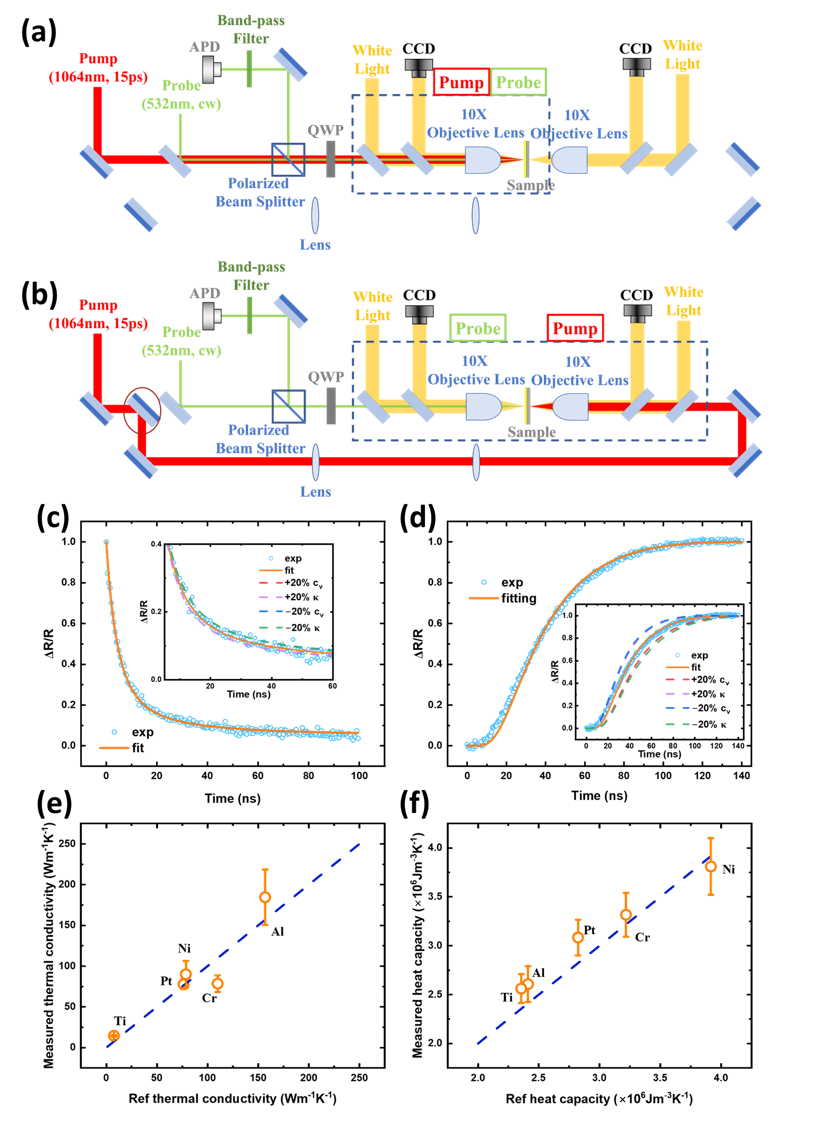 Fig. 4. (a-b) Optical layouts of the double-sided pump-probe. (c-d) Normalized experimental reflectivity change of probe and simulation curves. (e-f) The comparison between the results from this study and the reference values.
References
[1] Jeong, J., Li, X., Lee, S., Shi, L., & Wang, Y. (2021). Transient hydrodynamic lattice cooling by picosecond laser irradiation of graphite. Physical Review Letters, 127(8), 085901.
, “Picosecond Transient Thermoreflectance for Thermal Conductivity Characterization,” Nanoscale and Microscale Thermophysical Engineering, In Press, 2019.
, “In-plane thermal conductivity measurement with nanosecond grating imaging technique,” Nanoscale and Microscale Thermophysical Engineering, vol. 22, no. 2, pp. 83-96, 2018.
, “Comparison between grating imaging and transient grating techniques on measuring carrier diffusion in semiconductor,” Nanoscale and Microscale Thermophysical Engineering, vol. 22, no. 4, pp. 348-359, 2018.
[5] Ye, Z., Park, J., Zhang, Y., Meng, X., Disiena, M., Banerjee, S. K., … & Wang, Y. (2023). “Simultaneous Determination of Thermal Conductivity and Heat Capacity in Thin Films with Picosecond Transient Thermoreflectance and Picosecond Laser Flash.” Nanoscale and Microscale Thermophysical Engineering, 27(3-4), 182-194.