
Since it’s the beginning of the year, it might be a good idea to provide a general overview of what domestic energy consumption here in the US looks like. From personal experience, I realize that despite feeling well read and up-to-date on certain issues, we might not always be aware of the most basic facts and figures. Without knowledge of this data, it can be particularly difficult to justify claims or present equitable solutions. So, while this post may seem pretty elementary, it should lay the foundation for what we will discuss in the future.
The U.S. Energy Information Administration does a very good job of presenting data on domestic consumption; every year the organization releases an annual report detailing our country’s energy production and consumption profile. Additionally, the group makes forecasts and provides financial analyses, documents information on other countries’ energy use, and publishes articles on greenhouse gas emissions. In short, if you are looking for hard numbers on anything energy, the EIA is an excellent first stop.
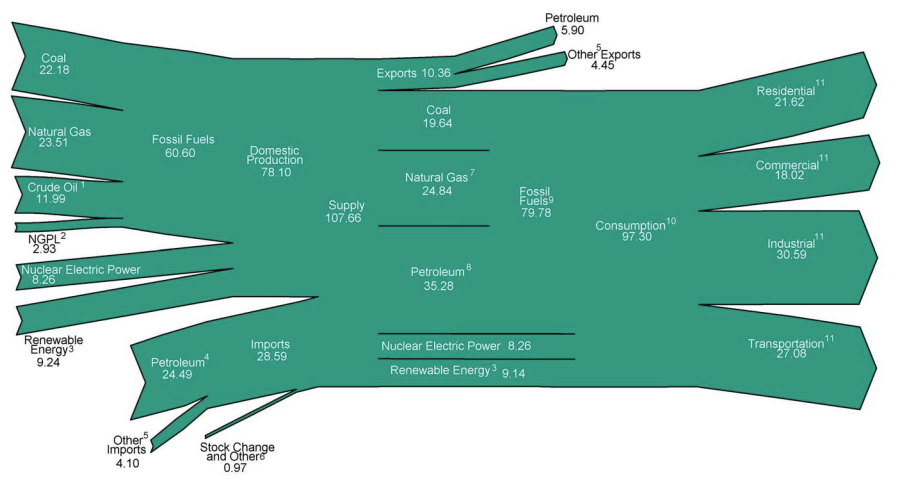
That being said, let’s take a look at what the EIA has to say about the United States. In 2011, the world as a whole consumed about 536 quadrillion BTUs (quads) of energy, and the US’s share was roughly 18% of that, at 97.3 quads (to try and put that into perspective, one quad is roughly 8 billion gallons of gasoline). Additionally, our population comprises only about 4% of the total world population. We can see from those numbers that on a per capita basis, Americans use quite a bit of energy. After all, energy gives us freedom—something highly valued here in the States.
We Are Heavily Dependent on Fossil Fuels
Of our 2011 primary energy consumption, over 80% was derived from fossil fuels. About 8.5% was provided through nuclear reactors, and 9.4% came from renewable sources (geothermal, solar PV, wind, biomass, and hydro).
Source: EIA
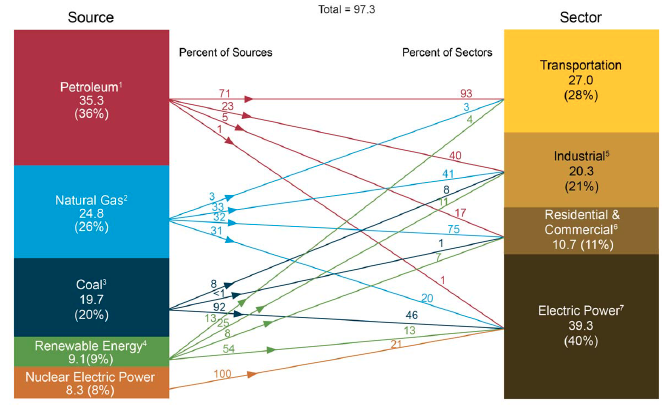
To take a closer look at that breakdown – 36% of our nation’s energy comes from petroleum, 26% from natural gas, and 20% from coal. Though we are poised to see an increase in natural gas consumption and a drop in coal use—especially in light of the EPA’s proposed updates to the Clean Air Act, which would curtail allowable power plant emissions—this expected trade-off will still occur between fossil fuel sources.
Oil Is Used for Transport, Not for Electricity
Source: EIA
Our petroleum consumption is used primarily to fuel our transportation sector. Revolutionary technologies that power vehicles through renewables or natural gas simply have not developed to the point of widespread feasibility. Additionally, petroleum is rarely used in the electric power sector, as it is much more expensive than the available alternatives.
Renewables Are Growing
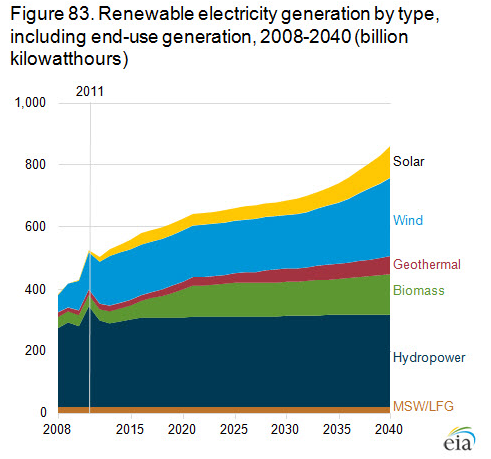
Despite the rising supply of natural gas, the amount of renewable energy production is increasing across the United States. Moreover, given current legislation and levels of information, it is slated to continue going up—albeit rather slowly—in the years to come. Overall, the total amount of renewable energy in our mix was 9.14 Quads in 2011, or roughly 9.4% of our total consumption.
Source: EIA Annual Energy Review 2011
There are a number of obstacles blocking widespread renewable energy adoption—and not all of them are technological. Market, information distribution, institutional, and political barriers may all stand in the way and slow the growth of this area. If we can overcome some of these hurdles, future projections may show more positive outlooks for sustainable energy development.
Challenges Ahead
Data indicates that there is positive relationship between national wealth and energy consumption. It makes sense, of course. Energy provides us with modern, comfortable lives. It allows us to stay connected; it gives us options and opportunities. If we can afford it, we will want to use more and more of it. Asking us to consume less when we are capable of consuming more will always be a hard sell to make. It is important, therefore, in our efforts to curb climate change, for us to examine areas where there is the potential to reduce emissions without sacrificing quality of life. Our hope is to do just that throughout the course of this year—stay tuned.