Warning! Numbers ahead!
In 2011, the United States contributed 5,490 million metric tons of CO2 to the world total of 32,578 million metric tons for the same year, according to the International Energy Agency. This means that 4% of the Earth’s inhabitants were responsible for 17% of total CO2 emissions. While the total US emissions are actually declining due to reduced demand for coal and increasing efficiency standards, the US still emits more CO2 than every country on Earth except for China and is historically in a league of their own for GHG emissions.
Of that total, Texas was responsible for emitting 652.6 million metric tons of CO2, almost double what the most populous US state, California, emitted in 2011. If Texas was a country it would be the 7th highest emitting country, ranked between Germany and Iran. For a state that represents 8% of the US population but 12% of its emissions, Texas is an influential player in the global climate debate.
The reason for Texas’ proud ranking as the number one emitter of greenhouse gases in the United States becomes clear when we look at production areas where Texas holds the coveted number one spot:
- 1st in Total Energy produced – 12,582 trillion Btu, 2nd place Wyoming produced 10,353 tbtu
- 1st in Crude Oil Produced – 77,250 thousand barrels, 2nd place North Dakota produced 24,642 kb
- 1st in Natural Gas produced – 7,112,863 million cu ft, 2nd place Louisiana produced 3,029,206 mcft
- 1st in Electricity produced – 41,145 MWh, 2nd place Florida produced 20,619 MWh
The reason for all this production? Texas is also the largest sectoral consumer of most forms of energy as well:
- 1st in Residential energy consumption – 1,745.5 trillion Btu, 2nd place is California at 1,516.1 tBtu
- 2nd in Commercial energy consumption – 1,555.5 trillion Btu, 1st is California at 1,556.1 tBtu
- 1st in Industrial energy consumption – 6,087.6 trillion Btu, 2nd is California 2,679.7 tBtu
- 2nd in Transportation energy consumption – 2,818.0 trillion Btu, 1st is California at 3,000.5 tBtu
- 1st in total energy consumption – 12,206.6 trillion Btu, 2nd is California 7,858.4 tBtu
There seems to be trend here: Large, populous states with sprawling cities consume quite a bit of energy. A stunning conclusion, I know. However, the important message to glean from these numbers is that any change to Texan energy production or consumption has the potential to make substantive and noticeable impacts on US total emissions. However, Texans will not tolerate any reductions in emissions which could potentially hamper the state’s economic activity. Therefore, the utilities who produce and deliver electricity in the state of Texas will need sustainable economic incentives before any real reductions will occur. To show how exactly this could occur, I will tell a story about one such utility, a coal plant, and the city of San Antonio.
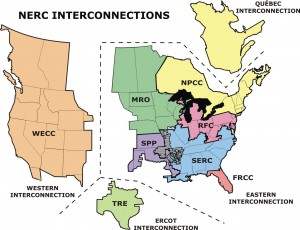
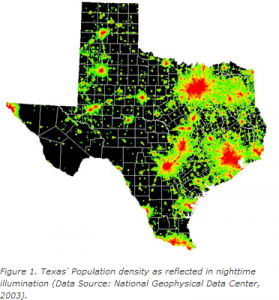
In the United States there are 3 grids – the Eastern Interconnection, the Western Interconnection, and Texas, known as the Electric Reliability Council of Texas or ERCOT for short. Kate Galbraith of the Texas Tribune provides an excellent explanation of the Texas grid as an extension of Texan “secessionist inclinations”. In short, Texas created its own grid in the 1930s with very limited internconnections to other grids in the US in order to avoid regulation by the Federal Energy Regulatory Commission (FERC). It is worth noting that while ERCOT does not cover the entire state, it does include Houston, Dallas, Fort Worth, San Antonio, and Austin, the 5 largest cities in the state – 3 of which are among the 10 ten largest cities in the US.
 source: http://www.nerc.com/AboutNERC/keyplayers/Documents/NERC_Regions_Color_072512.jpg
To further complicate matters, the Texas electricity market was restructured in 1999. As part of the restructuring, Texas established Renewable Portfolio Standards with the goal of installing an additional 2,000 MW of renewable capacity every year until 2009. To date, Texas has installed 10,400MW of wind and solar generating capacity. Furthermore, Texas Senate Bill 7 deregulated the electricity market in 2002, which allowed power consumers to choose their own electricity service from a variety of Retail Electric Providers (REPs). However, municipally-owned electric utilities and electric cooperatives were given the option to choose whether to participate in the Texas retail electric market.
CPS Energy in San Antonio is the nation’s largest municipally owned energy utility and the 4th largest energy utility in ERCOT. They generate 2,184 MW of electricity from four coal fired generators (Spruce 1 & 2 and Deely 1 & 2), 3,001 MW from four Natural Gas generators (AVR, Sommers, Braunig, and Rio Nogales), 1,080 MW from Nuclear reactors (South Texas Project 1 &2), and from 631 MW from three quick start natural gas generators called “Peakers”, (Leon Creek, Tuttle, Braunig Peakers) which are used in times of high demand.
J T Deely, an 871 MW coal plant in the CPS energy portfolio emitted 5,911,069 tons of CO2e, 1,186 tons Methane, and 27,995 tons of Nitrous Oxide in both 2010 and again in 2011. Due to the amount of emissions from the plant, Federal clean-air regulations to install sulfur dioxide scrubbers on the plant would have cost CPS $555 million. CPS Energy was faced with a decision: either they could pay the half a billion dollars to upgrade the plant, or they could phase out the plant over time and make up the difference by taking advantage of the Texas Renewable Portfolio Standards which required them to generate a certain percentage of their electricity from renewable sources anyway. For CPS, the cost of investing in new wind and solar generation and taking advantage of existing natural gas generation was cheaper than the abatement costs to keep the coal plant running for another decade. To recover the lost MW from the coal plant, CPS has partnered with OCI Solar Power to construct a 400MW solar farm – the largest municipal solar farm in the country.
So how much is 5,911,069 tons of CO2 per year? It’s the equivalent of the 2011 CO2 emissions for the entire state of Vermont or the entire country of Georgia. The implications of this are enormous when we consider that J T Deely does not even emit 1/3 of what Martin Lake Coal plant in Tatum, TX emitted in 2011 (18,352,021 tons of CO2, 3,903 tons of Methane, and 92,157 tons of Nitrous Oxide). Simply closing old, unprofitable coal plants in Texas and investing in lower-carbon emitting technologies can have a substantial impact on US greenhouse gas emissions.
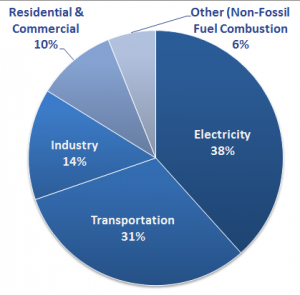
US CARBON DIOXIDE EMISSIONS BY SOURCE – 2011:
source: http://www.epa.gov/climatechange/ghgemissions/sources/electricity.html#reducingEmissions
Electricity production currently represents the largest chunk of US greenhouse gas emissions. Of that chunk, coal power generation represents the largest amount of greenhouse gas emissions by any energy source. As illustrated by the CPS case, emission reductions can occur without broad mandates, timetables, or targets from the federal government (and in Texas, federal mandates can be quite limited in their effects). Instead, there is a delicate dance between regulation and electricity generation that involves grids, states, utilities, and municipalities.
Today, many utilities are taking a hard look at their energy portfolios and asking themselves whether they can continue to make a profit from coal power generation. Due to incredibly low natural gas prices, coal is currently losing the battle. However, the great unknown is the extent to which federal and state incentives will encourage investment in distributed generation for wind and solar power. Furthermore, how will the utilities which deliver and transmit electric power manage competition from their own customers, especially in big, deregulated markets like Texas? For more on this ongoing saga, tune in next time for “Distributed Generation: the Great Unknown” or “Old Dog, New Tricks: why utilities secretly fear renewables”.


