Generally, LULUCF abatement solutions are natural, readily available,[1] and unlike some of the other sectors, can be implemented with existing technology.
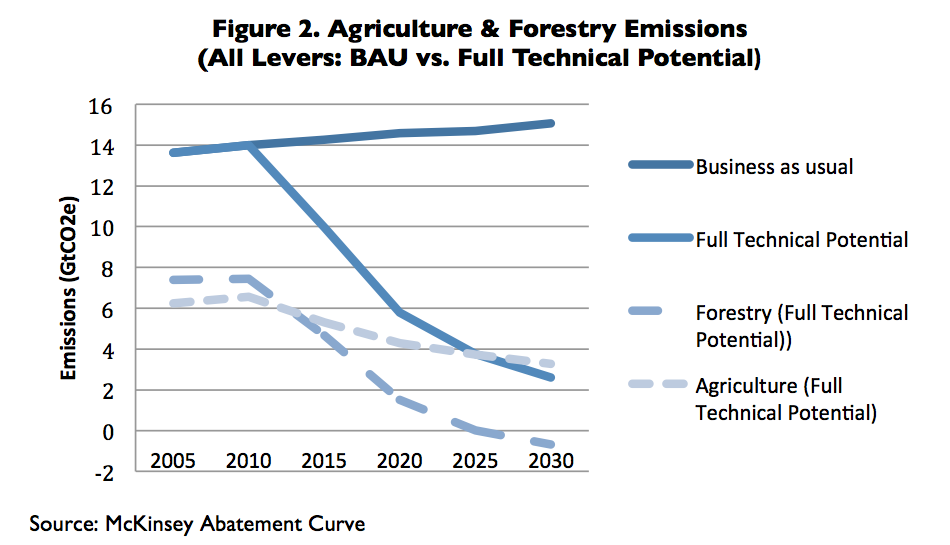
According to the McKinsey Solutions Climate Desk, all LULUCF and agriculture measures have full global technical potential of 2.6 GtCO2e per year by 2030, 12.46 GtCO2e less than projected BAU levels or equivalent to an 82.7% reduction. However, this includes emissions related to short-lived gases. Removing levers associated with short-lived gases, full global technical potential is 4.37 GtCO2e per year worldwide by 2030, 10.69 GtCO2e less than projected BAU levels or equivalent to a 71% reduction. Of this, agriculture contributes a reduction of 3.53 GtCO2e while forestry contributes 7.16 GtCO2e reduction.
However, political instability, weak government capacity and little financing for greenhouse gas reduction activities hinder the potential to fully capture the “low hanging fruit” of the LULUCF and agriculture sector. The following abatement analysis is broken down between agriculture and forestry activities and is modified from existing models and abatement cost curves. Building off of existing models, analysis focuses on three major factors that hinder full technical potential (fully capturing all potential). These include:
- Removing impact of short-lived gases. Land-related GHG emissions include carbon dioxide (CO2), nitrous oxide (N2O),[2] methane (CH4), perfluorochemicals (PFCs), hydrofluorocarbons (HFCs) and sulfur hexafluoride (SF6), this section focuses only on CO2 and N2O emissions. For strategies that included components of the short-lived gases, a percentage (?[3]) of emission reduction was subtracted based on percentage breakdown of emission types per activity.
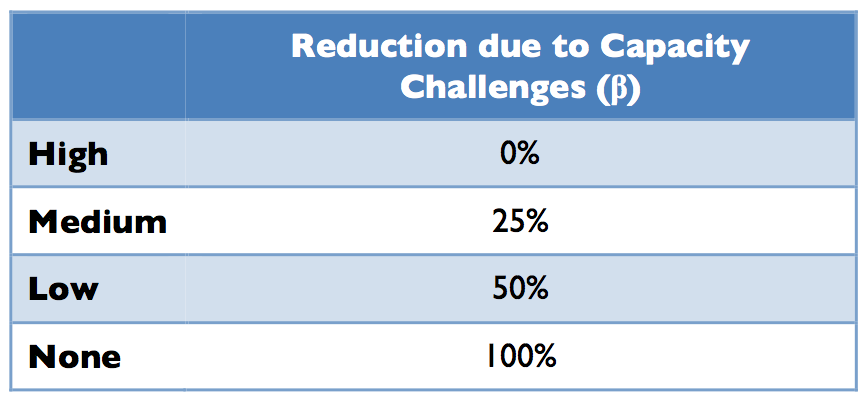
- Political stability or fragmentation of governance structures to enforce mitigation strategies. Many countries that contribute, and therefore have the greatest potential for reduction in the land-related sectors, face either political instability or weaker governance capacity for enforcement of environment laws. These include countries in Africa (namely the Central African Republic and Democratic Republic of Congo), parts of Southeast Asia (namely Indonesia and Malaysia) and South America (namely Brazil). Furthermore, decentralization of landowners and small plots poses another challenge to large-scale success. Analysis uses the following guideline to apply a percentage reduction from full technical potential to factor in political or governance challenges:
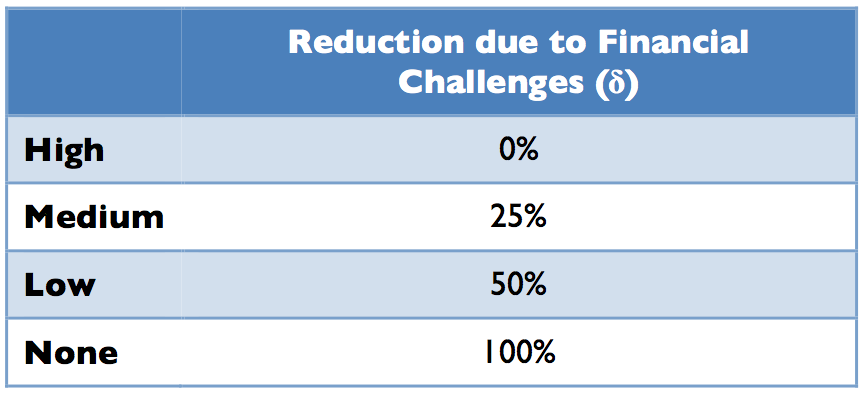
- Financial feasibility in each country to finance each lever according to:
As such, each lever is taken as a percentage of full technical potential such that our proposed greenhouse gas emissions reduction per strategy, per country is calculated as:
Proposed Potential = Full Technical * (1 – ? – ? – ?)
Our analysis generates emission levels of 10.68 GtCO2e worldwide by 2030, that is a 29% reduction from projected BAU emissions for 2030 or a potential abatement of 4.89 GtCO2e. As seen in the table above, the gap between full technical potential and our proposed potential is largely due to the forestry sector. This is partly due to the significant reduction of greenhouse gases from agriculture relate to short-lived gases, but also demonstrates the tremendous importance forests play in the fight to reduce GHG emissions.
[1] Ellison, David et al. “The Incentive Gap: LULUCF and the Kyoto Mechanism Before and After Durban.” Global Change Biology Bioenergy. Vol. 5. Pg. 599-622., Oct. 16, 2012.
[2] Globally, 40% of N2O emissions are human-induced. N2O emissions from agriculture are emitted through the use of synthetic fertilizers. N2O particles remain in the atmosphere for over 120 years before being removed through a sink or destroyed by a chemical reaction. The warming impact of 1 pound of N2O is 300 times that of CO2. (Source: http://epa.gov/climatechange/ghgemissions/gases/n2o.html)
[3] The percentage of emissions per activity that comes from short-lived gases.


