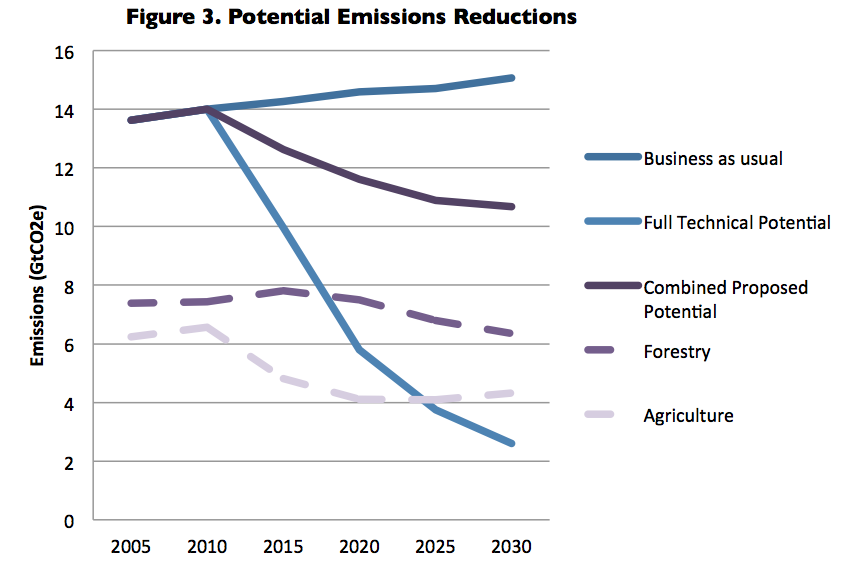
As mentioned in an earlier post, our analysis of the McKinsey Abatement Cost Curve suggests greenhouse gas emission levels worldwide from forestry and agriculture could fall to 10.68 GtCO2e by 2030, a 29% reduction from projected business as usual (BAU) emissions for 2030 or a potential abatement of 4.89 GtCO2e. The gap between full technical potential and our proposed potential is largely due to the forestry sector, underscoring just how important strides must be made against deforestation towards afforestation or reforestation.
LULUCF and agriculture emissions are projected to fall between 2015 and 2030. Agriculture abatement potential is projected to decline sharply and rises steadily between 2020 and 2030. This is due to low expectations to reach full potential of abatement in areas where abatement is most prominent (mainly in developing Africa due to political instability and developing Asia due to challenges working with smallholder farmers). As agriculture abatement begins to increase, the role of forestry will slightly decline overall but remains the bigger contributor to abatement between the two sectors.
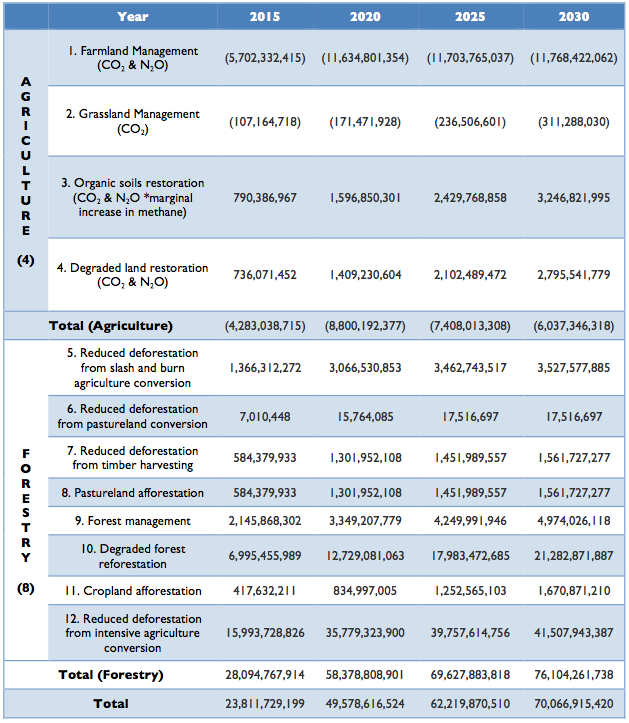
By breaking down abatement strategies identified by the McKinsey Abatement Cost Curve, we have narrowed down to 12 important strategies, 4 agriculture-related and 8 forestry-related activities that can help us achieve the potential abatement above.
Although agriculture levers contribute a smaller portion of the emissions reductions for LULUCF, they offer greater benefits to costs than forestry levers. Two of the four strategies selected are cost saving for all countries. The net cost of all agricultural activities are positive for the 2015, 2020, 2025, and 2030 timeframes of projects. Under full technical potential, the top 50% of emissions from agriculture would be from Africa, China, Indonesia and Russia. However, taking into consideration barriers of implementation, the top 50% of emissions reductions in agriculture will be from developing Asia, China, Russia and USA. For 2015 and 2030, developing Africa ranks in the top 5 emitters. This illustrates the sheer volume of potential abatement in the region, despite high barriers to implementation. A brief discussion of each individual lever follows:
FARMLAND MANAGEMENT (0.199 GTCO2E PER YEAR BY 2030)
Cropland nutrient, tillage and residue management provide significant cost-savings and require low technology. The key to achieving full potential is education and changing simple behaviors such as replacing nitrogen fertilizers to sulfate-based fertilizers or reducing land tillage and residue burning to minimize GHG emissions. Cost-savings and greater crop productivity ensure higher buy-in from small plot farmers; therefore our model assumes high potential implementation with the exception of developing Africa (due to political instability and decentralization of smallholder farms) and Asia (due to lack of financing and decentralization of smallholder farms). Russia, China and the US offer the highest reductions in emissions (0.878 GtCO2e per year by 2030) while also enjoying the highest total savings of $1.85 billion, $2.14 billion and $2.76 billion,26 respectively, per year by 2030.
GRASSLAND MANAGEMENT (0.905 GTCO2E PER YEAR BY 2030)
More efficient grassland management through better nutrient management, increased grazing intensity, better irrigation and fire management practices also offer GHG emissions reduction while providing cost-saving opportunities in all countries. Therefore, our model assumes full potential implementation. The highest reduction in emissions will come from China (0.19 GtCO2e), followed by developing Asia (0.108 GtCO2e, likely Indonesia and Malaysia), USA (0.063 GtCO2e) and Russia (0.045 GtCO2e). The greatest savings will go to the US ($453 million per year by 2030). It is important to note that while emission reduction contributions from European countries such as Italy are minimal, their lower unit costs of implementation indicate “low hanging fruit” for agriculture levers and should be explored fully.
ORGANIC SOILS RESTORATION (0.553 GTCO2E PER YEAR BY 2030)
Organic soil restoration provides huge potential emissions, particularly in the area of peatlands – prevalent in Indonesia and Russia. Although organic soil restoration increases methane release, the offsets of CO2 sinks created marginalize the effect. However, restoration of peatlands and restoring water table levels requires intense effort and relatively high costs. Therefore, analysis assumes low ability to capture full potential and assume 50% success. The greatest contributor to emission reductions would be Indonesia (0.193 GtCO2e per year by 2030), but it would also face the highest costs of $1.7 billion by 2030.29 Despite plans to increase peatland conversion to non-forest use, we believe international actors’ willingness to finance activities (such as Norway under the REDD+ partnership) will continue to incentivize Indonesia to meet at least half of its potential reduction.
DEGRADED LAND RESTORATION (0.24 GTCO2E PER YEAR BY 2030)
Although relatively expensive compared to the other options, lever 6 is relatively easier to implement. Therefore, our analysis assumed full technical potential for either richer, developed nations (Japan, Europe, Italy, Canada, UK, Germany, France, US and China) or those with a relatively lower per tCO2e unit cost (Middle East). For the remaining countries (South Africa, Mexico, India, Rest of OECD Pacific, Russia, Brazil, the rest of Latin America and rest of developing Asia), lack of financing assumes 50% of full potential achieved. For developing Africa, the added barrier of political instability assume 25% of full potential achieved. The country with the biggest contribution to emissions reduction is China (0.055 GtCO2e per year by 2030). Despite facing high unit costs, China’s commitment to reducing its greenhouse gas emissions (as evidenced by “Sloping Land Conversion Program established in 2000 which aims to return more than 37 million acres of cropland back to forests or grasslands) and ability to encourage large-scale agricultural reforms allows it to still reach 50% of potential.
For a closer look at our analysis of Forestry-related abatement potential, see the next related post.


