
In 2010, Australia ranked tenth globally for its greenhouse gas (GHG) emissions. According to the Emission Database for Global Atmospheric Research (EDGAR), Australia’s GHG emissions accounted for approximately 1.54% of total global emissions. The Australian government reported its 2010 emissions to be 543.3 MtCO2e (excluding LULUCF). The country’s emissions have since declined, totaling 538.4 MtCO2e in December 2013. However, despite its relatively small contribution to global GHG emissions, Australia’s per capita CO2 emissions continue to exceed those of any other developed country.
Current and Projected Emissions by Sector
As can be seen from the chart below, the majority of Australia’s GHG emissions in 2011 came from the energy production sector (electricity, fugitives, and direct fuel combustion), followed by the agriculture, forestry, and other land use (AFOLU) sector.
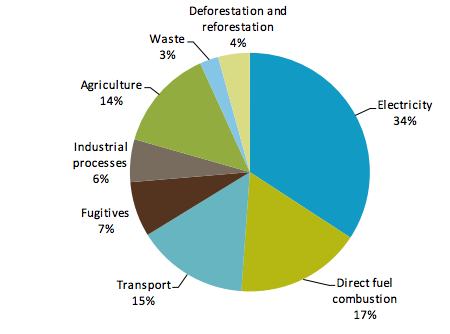
Source: Department of Industry, Innovation, Climate Change, Science, Research and Tertiary Education
Among Australia’s six states and ten territories, those with the highest GHG emissions levels in 2011 (excluding LULUCF) included New South Wales (148.9 MtCO2e/ 27% of total country emissions), followed by Queensland (134.5 MtCO2e/ 25%), Victoria (129.4 MtCO2e/ 24%), and Western Australia (75.9MtCO2e/ 14%). While stationary energy was responsible for the majority of each of these regions’ total GHG emissions, the transport sector accounted for the second largest portion of emissions in New South Wales and Victoria. Furthermore, the AFOLU sector accounted for a significant portion of Queensland and Western Australia’s total GHG emissions.
At the national scale, Australia’s emissions are projected to reach 801 MtCO2e in 2030, an increase of 216 MtCO2e since 2000 (586 MtCO2e). It should also be noted that a rise in emissions of 43 MtCO2e in the electricity sector would be the primary driver behind the country’s overall projected emissions increase. It thus follows that the greatest emissions abatement potential rests in the energy production sector, which is projected to account for 39% of the country’s total abatement potential in 2030. The technologies best able to unlock this potential include carbon capture and sequestration (CCS), onshore wind, and geothermal (McKinsey & Company).
How does this fit into the bigger picture?
Under the Kyoto Protocol, Australia is formally committed to limiting its average annual GHG emissions to 99.5% of 1990 levels between 2013 and 2020. This calculation is based on the country’s unconditional commitment to reduce its GHG emissions by 5% below 2000 levels by 2020. Depending on the activity of other nations, Australia is conditionally committed to increasing its emissions reduction to between 15% and 25%, and more broadly aims to reduce its emissions by 80% below 2000 levels by 2050. It should also be noted that Australia successfully met its initial commitment under the Kyoto Protocol, which required the country to limit its emissions between 2008 and 2012 to an average of 108% of 1990-level emissions (its emissions averaged 105% of 1990-level emissions during this period).
Despite Australia’s previous success in and continued efforts to meet its international emissions obligations, however, there is growing concern surrounding its emissions reduction target of 5% for 2020. In order to effectively contribute to the international goal of keeping global warming at or below two degrees Celsius, the Climate Change Authority (an independent advisory body to the federal government) states that Australia must set its emissions target at a minimum of 15% below 2000 levels by 2020. If Australia’s Kyoto Protocol commitments were factored in, the emissions reductions target would increase to19%.
In sum, Australia will need to increase its efforts to reduce its GHG emissions in order to substantially contribute to the fight against global warming. Uncertainty surrounding the effectiveness of the proposed Direct Action Plan, which was discussed in further detail in a previous blog post, adds to the urgency of the situation. Priority should be given to the sectors responsible for the highest levels of GHG emissions, among which include energy production and AFOLU.