Molten Salt Natural Circulation Loops

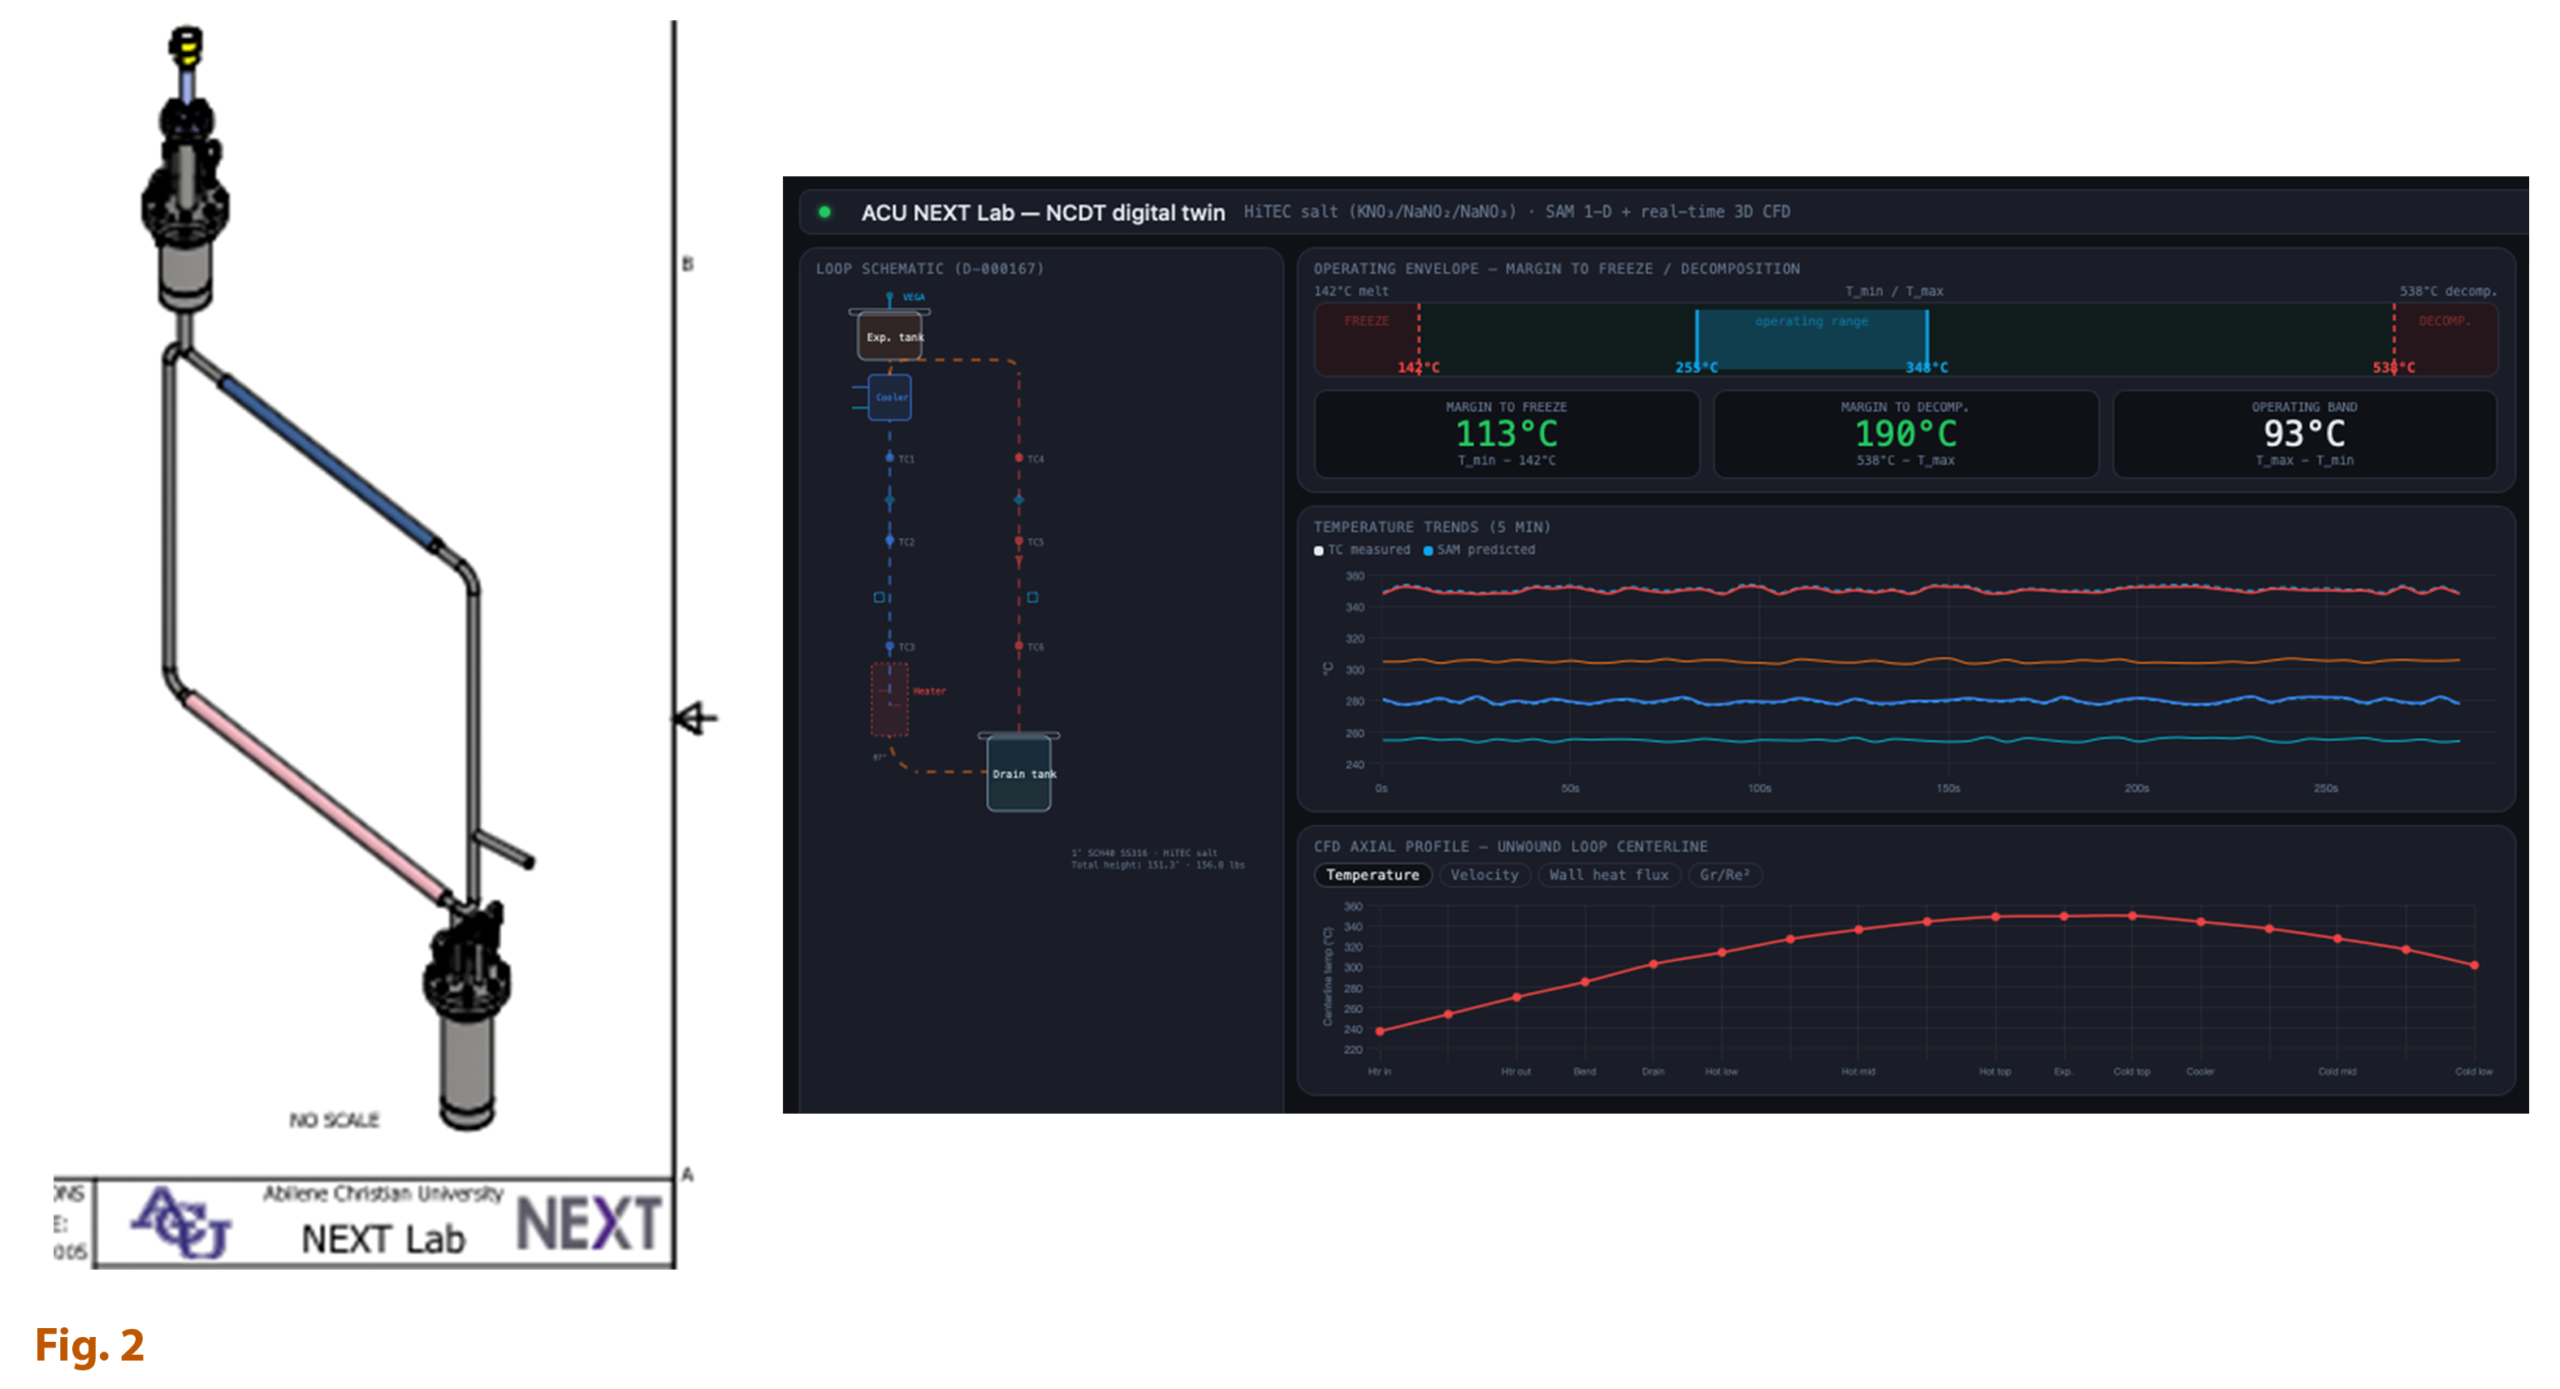
The University of Texas is working with Texas A&M University to develop digital twins for bubble-injection molten salt natural circulation loop facilities, while also partnering with Abilene Christian University and Virginia Commonwealth University to build additional natural circulation loop systems. Together, these facilities will produce a rich experimental dataset that supports the development and testing of digital twins for molten salt flow systems. These tools are intended to predict how the system responds to different inputs, such as heating and cooling, and to reconstruct full flow behavior by combining reduced-order models informed by high-fidelity simulations with the limited measurements available from instruments such as thermocouples and flow meters.

Figure 1 shows two experimental setups side by side. Left: a vertically oriented heated flow loop made of transparent tubing, wrapped with high‑temperature heating tape. Labeled components include a melting pot at the top, a cooling jacket along the upper section, a transparent heater section, a 20‑degree angled lower segment, and a drain at the bottom. Right: a laboratory optical measurement setup mounted on an aluminum frame. A green laser passes through a labeled test section and beam splitter toward two cameras labeled Camera 1 and Camera 2. An infrared camera is positioned below the test section. Wiring, mounts, and insulation surround the apparatus
Figure 1: Texas A&M Molten Salt Natural Circulation Loop Experiment. J. Reis, J. Seo, Y. Hassan, “Molten Salt Flow Visualization to Characterize Boundary Layer Behavior and Heat Transfer in a Natural Circulation Loop”, Physics of Fluids, 36, March 2024 https://pubs.aip.org/aip/pof/article/36/3/033605/3268730/Molten-salt-flow-visualization-to-characterize
Side-by-side visual showing a physical apparatus and a digital monitoring interface. On the left is a technical drawing of a vertically oriented loop system composed of metal piping and components, including a top valve assembly, angled pipe sections, and a lower cylindrical vessel; some pipe segments are color-coded blue and red to indicate temperature differences, and a dimension arrow marks the height. On the right is a dark-themed dashboard labeled “ACU NEXT Lab — NCDT digital twin,” displaying a schematic of the loop system, an operating temperature range bar (approximately 142°C to 538°C), margin indicators for freezing and decomposition, and multiple graphs showing temperature trends and a CFD axial profile. The overall figure is labeled “Fig. 2
Figure 2: Preliminary schematic of the ACU Molten Salt Natural Circulation Loop Experiment and Mock-up of an ACU Molten Salt Natural Circulation Loop Digital Twin Dashboard. Images from Abilene Christian University.