Convolutional Neural Networks (CNNs) are neural networks that can process images and identify objects within them. Although these methods of machine learning have been around for a long time, it was only within the past 10 years that the error of image classification was reduced to 15%, leading many companies and researchers to adopt these methods for data collection and image processing.
In the field of Disaster Planning, one particularly promising application of CNNs is detecting features in satellite images. While historically, researchers were limited by their ability to manually identify features in an image, CNNs now allow for identification on a large scale in a short amount of time. In our research on disaster risk planning in Oceania, we found informal settlements to be uniquely vulnerable to environmental hazards and believe that mapping their locations is important for finding those who are most at risk to sea-level rise and flooding. (More information on why these populations are especially vulnerable can be found here: Informal Settlements in Oceania).
For an area of the world we’ve found to have limited data, CNNs could fill a large gap in collecting and mapping information for disaster planning in Oceania. Informal settlements are just one of many features that CNNs can be trained to identify. A variety of features integral for disaster planning could be extracted from the satellite data, such as unmapped roads, the location of vehicles, or finding homes that are built from certain materials. This article aims to give an overview of CNNs, so that future researchers can have a general understanding of their capabilities and are aware of the uses and benefits that image processing could have for data collection and disaster planning.
Neural Networks
Neural Networks are a set of algorithms that are modeled similarly to the human brain and are trained to recognize patterns. They help us group and classify data based on labeled datasets that we produce to train neural networks for specific purposes. For example, if you wanted to train a neural network to understand if an email is spam or not, you would need to provide it with a dataset of emails that are labeled as spam and not spam. The network could detect patterns based on correlations to find what makes an email fit the ‘spam’ classification. It might find that emails with a certain amount of hyperlinks have a 0.85 probability of being spam, or that emails that use your last name have a 0.9 probability of not being spam.
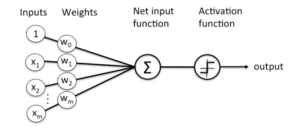
Deep learning occurs when multiple neural networks are “stacked” or are composed of several layers. Each layer contains nodes, which are the areas where computation happens. They are somewhat similar to neurons in the human brain; where they “fire” based on whether or not they receive sufficient stimuli. Each node takes the data input and runs it through a series of weights that either increase the likelihood that the node should “fire” or decrease the likelihood. These weights change and are learned based on the labeled datasets that assign significance to which inputs are most important for determining the desired outcome. Going back to our earlier example, the weights are how much your name or the number of links in an email determines whether the email is spam or not (0.85 or 0.9). When the data is run through many of these weights, they form the Net Input Function. This is then run through the Activation Function to determine whether or not the node should “fire” or pass on the information that something fits the classification (i.e. spam or not spam).

Figure 1. A diagram of a single node in a neural network, which looks similar to a neuron.
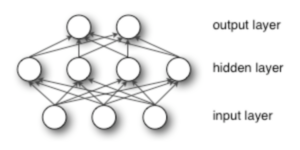
Each of these neuron-like nodes is shown as a circle below. Each layer contains multiple nodes that determine the subsequent layer’s input. Each layer is trained by the layer before it, allowing for more complex features to be recognized as they aggregate and recombine the information from the previous layers. Each time a neural network functions, it guesses the classification outcome with a probability and assigned error based on it’s weights. As we teach the neural network what is a correct or incorrect classification, it updates its weights and slowly learns to pay attention to the most important features of the data.

Figure 2. A diagram of node layers.
Image Classification and Convolutional Neural Networks:
Image Classification is the process of inputting an image and outputting a class (a car, road etc.) or the probability that the image contains the specified class. Computers see images as matrices of numbers that are based on the pixel values in an image. These matrices are not just 2 dimensions but are actually multidimensional matrices known as tensors. Images typically have three dimensions: height, width, and color depth.

Figure 3. A diagram of a numeric matrix that represents the pixel value in an image.
Similar to neural networks, convolutional neural networks contain nodes that have learnable weights. The primary difference is that CNNs are built to assume images as the input. Typical neural networks don’t scale well to images, as you can quickly get to hundreds of thousands of weights for each pixel. Rather, CNNs take advantage of the 3 layers of the image and arrange the nodes in the three dimensions.

Figure 4. Left: A Typical Neural Network, Right: A Convolutional Neural Network that arranges neurons in three dimensions.
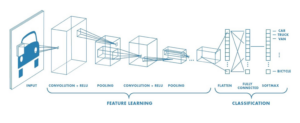
CNNs take an image and pass the data through convolution layers, pooling (downsampling) layers and fully connected layers to get an output.

Figure 5. A diagram of a CNN distinguishing the different layers.
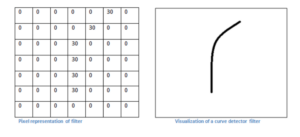
Think of the convolutional layer like a magnifying glass passing over each area of an image. The magnifying glass is our node that assigns weights and does a computation on each part of the image. The magnifying glass slides, or convolves, across the image and runs pixels against a set of filters. Like the precoded data that taught our neural network, CNN filters identify certain features of the data such as corners, curves or edges. As the magnifying glass colvulves across our image, these filters are being run against the pixels and “fire” or pass on classification (for example as a curve, below) if they meet the filter requirements.
Pooling Layers exist to compress data, for example taking the maximum or average value of a certain area of pixels. Convolutional layers can sometimes be too sensitive to the location of features, so pooling exists to allow summarizing of the location of features.

Figure 6. A diagram showing a pixel representation of a curve compared to a visual representation of a curve.
The Fully Connected Layer takes the inputs from the previous layers and outputs a vector with the probability that the image contains each of the classifications. For example, if you input an image of Suva, Fiji, and we set the classifications to be (urban, suburban, rural) the vector might say (.9, .6, .2) based on the probability of the image meeting each of the classifications. Once you’ve trained your CNN to identify the desired classifications, multiple images can be processed, stitched together and geotagged for further research.
Object Recognition in Oceania
The accuracy of object recognition from satellite imagery has advanced rapidly in the last decade, and multiple tools have been developed to simplify this data collection method. For example, AcrGIS Pro has a tool to Detect Objects Using Deep Learning, and Picterra is an online tool that allows users to train a neural network using their precoded algorithms. Future research into object recognition in Oceania should compare and contrast existing CNN tools and check their accuracy for the region.
The US government has already begun research into AI and object detection from satellite images. The USGS even has a Hydrologic Remote Sensing Branch that could potentially share information or guide efforts to gather data for the region. The ability to identify populations that are the most at-risk for flooding and sea-level rise will be invaluable for Oceania, and even more important for the most vulnerable members of the population; those living in informal settlements. Hopefully, this data could be collected and shared with Oceanic countries’ governments to allow them to plan for the rising tides ahead.

