As the group crosses into serious data collection and needs visual tools to help express important data trends across geography, it is good time to list the challenges of hot spot mapping as it relates to Oceania. It’s important to remember, hot spot maps are supporting graphics, illustrating geographic trends based on a variety of data inputs that are deemed relevant or applicable. These challenges go beyond the conventional sense of data quality, though data quality is certainly the most important aspect of any mapping effort. Challenges can be as broad as determining how a map can represent the trend being observed (i.e. what is the map supposed to convey), or as narrow as determining the significance of data in a specific geographic area. Additionally, data, particularly sub-national demographic data, is difficult to find and hard to validate. What data can be found often is tangential, requiring a methodology of analysis from which conclusions can be drawn. Finally, there is simply a limit to granular publicly available data in Oceania. What data is readily available for Oceania is often at the national level, leaving out sub-national populations that may have unique challenges in the face of climate change. This blog post will explore these challenges and asks the group to consider these when needing data mapped.
The Objective: What’s the Hot Spot Map Saying?
The purpose of a hot spot map may seem relatively straightforward, but, as the saying goes, “You don’t know, what you don’t know.” Building general maps can be informative, they can lay out relative geography and perhaps group certain populations or features together to create a helpful context. However, general maps do not represent the story of data. Hot spots maps should be tailored to emphasize findings supported by data. It is one thing to build a map that shows the probability of a typhoon strike on an island in the pacific. It is another to have a map identifying the impact of a typhoon strike to a sub-national island population. While a map providing the likelihood of a typhoon strike is certainly interesting, it does not really tell much about the implications of a disaster and disaster management. Sure, an island may experience more storms, with increasing intensity, which will correlate to greater disaster; but, these implications can be assumed without the use of a map.
Thus the objective of a hot spot map, in this project, should really be about supporting the greater story of climate related disaster in Oceania. For example, not only should a hot spot map purport the increased likelihood of typhoons, but it should also account for additional data (geologic, demographic, economic, etc.) that either increase or decrease a geographically bound population’s resiliency. In this way, the map disseminates where and to whom climate change related risks pose a greater threat. To get there; however, there has to be a wealth of relevant and strategically selected data, which is easy to come by for Oceania island nations.
Data
Data is an obstacle for hot spot mapping in Oceania both in terms of acquiring data and ensuring its accuracy. Oceania nations, particularly those not affiliated with a larger state such as France or the US, often do not have detailed data reporting requirements or capacity. There are a number of reasons for this. A state may not have the financial or human resources for data collection, it may not have sufficient software tools to make use of the data, the data in question may never have been required before, etc. Furthermore, what data are available are often only at a highest level and in aggregate with broader populations. This makes finding the impacts of climate change as it relates to smaller demographics difficult, if not impossible, to determine. The data may show the situation of a sate to be relatively good, but there may well be sub-national populations at risk of being wiped out by a climate related disaster. For example, Maternal mortality is often used as a strong indicator of systemic healthcare services and development in countries. Generally speaking, Oceania states have experienced a decline in maternal mortality over the past decade. However, the data readily available appears to be in aggregate for islands and does not seem to capture particular sub-national populations within a country which may have greater or increasing rates. Furthermore, there appear to be gaps in the data gathered, skewing the results of the map and providing misleading graphics of serious issues.
Formulating a Methodology
If the map has a purpose, and there is tangential data to support it, how do the two mix? That is where methodology comes in. Often times, the data available are not a perfect fit for the situation the map is seeking to address. Instead, mapping requires the use of alternative data (birth rates, economic equality, disease, etc.) and correlate the alternative data to a larger conclusion about a population’s unique risk in a unique geographic area. Choosing how to apply certain data points to broader conclusions can be tricky. There are some data correlations that have been established and reinforced by other studies, making them logical secondary sources to describe a situation (maternal mortality rates above). More likely, data and mapping practitioners will need to develop a methodology and justify it for custom hot spot mapping.
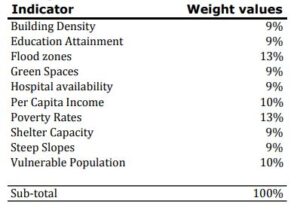
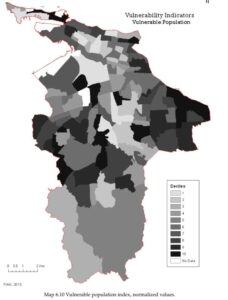
Developing a hot spot map methodology requires more than just gathering data and tagging it to a geographic location. Some methodology will be based on regression analysis of existing data which allows for the statistical determination of significance. Yet there also must be some logical analysis in order to correlate tangential data to climate vulnerability in a geographic area. In a study on the impacts of climate change vulnerability in Puerto Rico, the author weighted a variety of data inputs which determined a geographic area’s risk vulnerability. The valuation of the weights was determined with a combination of some regression analysis based on available data, some fieldwork data gathering, and some logical reasoning based on both data and field observations.

Figure 1. Value weights of climate risk in Puerto Rico

Figure 2. Composite index of vulnerable populations in San Juan
Oceania Map Limitations: Granularity of Island Data
After addressing the previous three issues, which are endemic of hot spot mapping in general, what ends up being the biggest obstacle to hot spot mapping in Oceania is granularity. The island nations of Oceania are geographically minuscule and their populations are small compared to virtually all other countries in the world. As mentioned previously, data gathered in Oceania is often aggregated at the national level and fails to capture sub-national geographies, development, and demographics in any significant detail. This is particularly true of states that are composed of a series of small islands with different geological and demographic profiles from one island to the next. Furthermore, even if this data was captured the base shape files that would be able to accurately portray it come at a high cost or simply do not exist.
Overcoming the granularity problem will require a fair amount of manual labor. First, there will need to be a great deal of field work done on each island (or at least a reflective sample of islands) to gather granular (sub-national) demographic and geologic data. The data for each island will then need to be evaluated and weighted within the context of climate change risk and the risk climate related disaster. Finally, in order to effectively express the new level of sub-national granularity, hot spot mappers will need to manually construct base maps with greater geographic granularity of island states. These three items are easier said then done.

