Content creators can add tabular data that is accessible to people using assistive technology and is responsive on small devices to any page on the website, using the tools in the Rich Text editor.
Tabular data is structured to be “read” in tables and rows, like a bus schedule. It is different than grid layouts, which use columns and rows for layout purposes only. Tables should not be used for creating grid layouts.
If the tabular data you wish to create is overly complex, please contact the Web team.
Steps
In the Rich Text editor put the cursor in the content where you want to add the table. Find the data table icon ![]() in the Rich Text Editor and click the caret. In the pop up, drag to select the number of rows and columns.
in the Rich Text Editor and click the caret. In the pop up, drag to select the number of rows and columns.
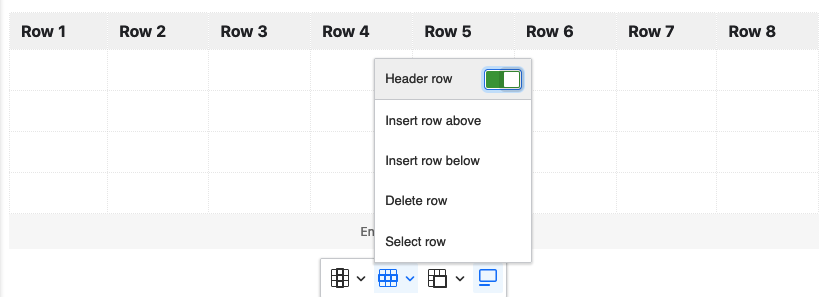
Required: You must include headers to make the table accessible. To add headers highlight your header row or header column row, then click on the horizontal row or vertical column icon from the table editing toolbar. From the pop-up click the Header Row or Header Column button. It is also required that every header cell must have text. It is not advised to have more than one header row or header column in a single table.

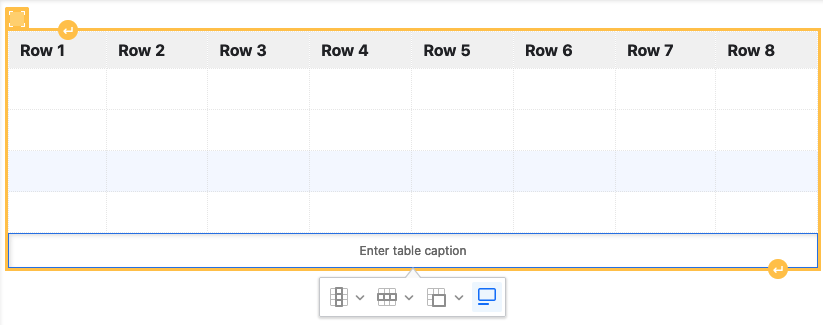
Highly Recommended: You must include a caption unless the table is identified and described within the document. A caption is like a heading for a table and screen readers announce the content of captions. This helps users to find a table and understand what it’s about, and decide if they want to read it. Please follow this link for further reading on captions.
To add a Caption select the caption option at the far right side of the table toolbar and add your caption in the caption box. Usually the Caption will appear above the table but it may be styled so that it appears visually below the caption. It is still read at the top of the table by a screen reader browser such as JAWS (Job Access With Speech).

Once you have completed editing your table publish your page to save your table.
Learn More
Please read up on coding accessible tables on Web AIM.
Learn techniques for adding captions and summaries to your data tables.


